Yup'ik vs Eastern European Median Female Earnings
COMPARE
Yup'ik
Eastern European
Median Female Earnings
Median Female Earnings Comparison
Yup'ik
Eastern Europeans
$32,730
MEDIAN FEMALE EARNINGS
0.0/ 100
METRIC RATING
342nd/ 347
METRIC RANK
$45,385
MEDIAN FEMALE EARNINGS
100.0/ 100
METRIC RATING
19th/ 347
METRIC RANK
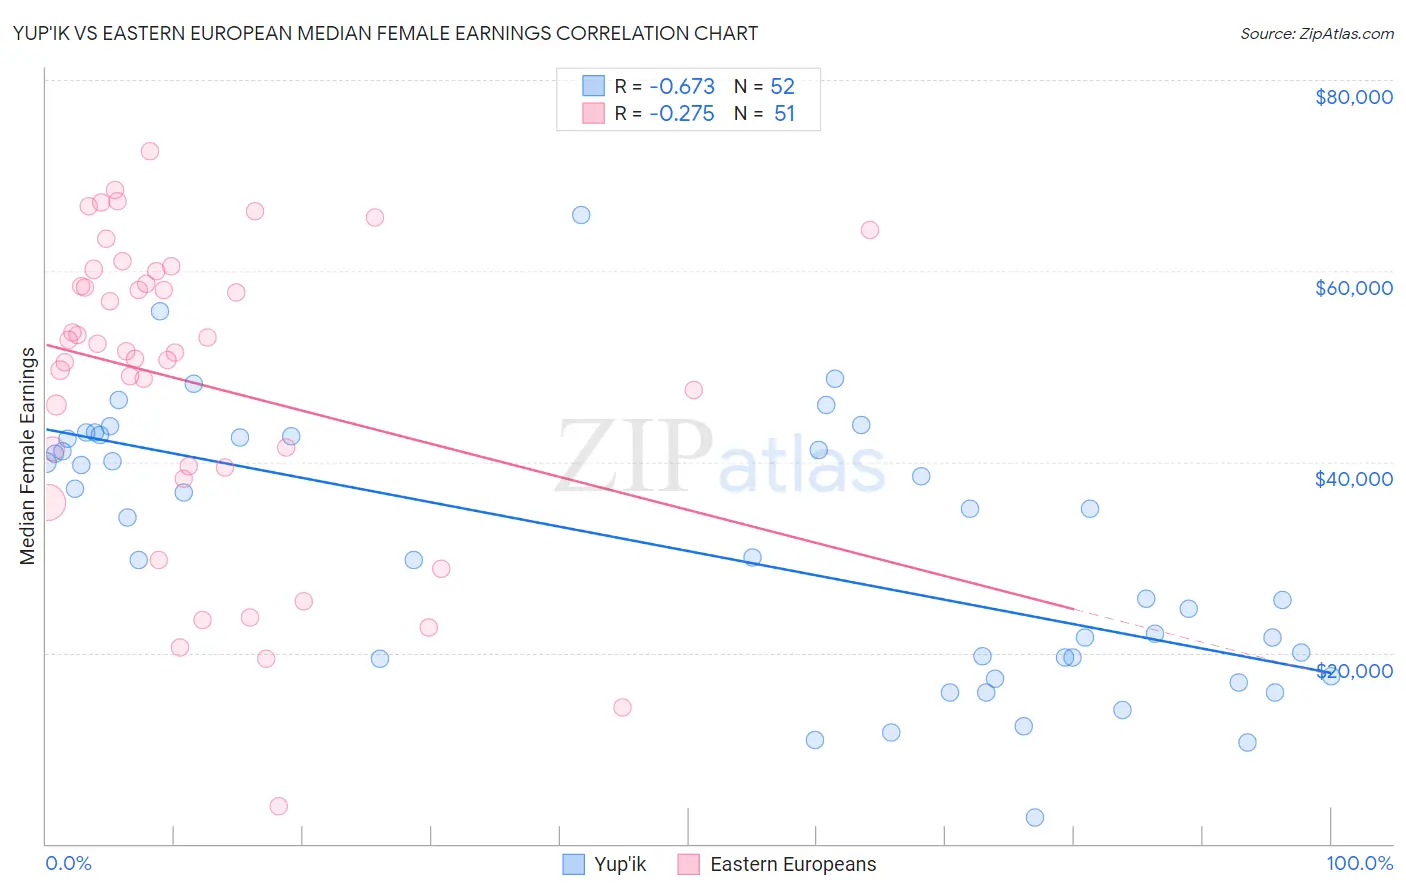
Yup'ik vs Eastern European Median Female Earnings Correlation Chart
The statistical analysis conducted on geographies consisting of 39,946,861 people shows a significant negative correlation between the proportion of Yup'ik and median female earnings in the United States with a correlation coefficient (R) of -0.673 and weighted average of $32,730. Similarly, the statistical analysis conducted on geographies consisting of 460,854,647 people shows a weak negative correlation between the proportion of Eastern Europeans and median female earnings in the United States with a correlation coefficient (R) of -0.275 and weighted average of $45,385, a difference of 38.7%.
Median Female Earnings Correlation Summary
| Measurement | Yup'ik | Eastern European |
| Minimum | $2,800 | $3,984 |
| Maximum | $65,833 | $72,541 |
| Range | $63,033 | $68,557 |
| Mean | $30,861 | $48,179 |
| Median | $32,085 | $51,543 |
| Interquartile 25% (IQ1) | $19,410 | $39,388 |
| Interquartile 75% (IQ3) | $42,445 | $59,979 |
| Interquartile Range (IQR) | $23,035 | $20,591 |
| Standard Deviation (Sample) | $13,771 | $16,076 |
| Standard Deviation (Population) | $13,638 | $15,918 |
Similar Demographics by Median Female Earnings
Demographics Similar to Yup'ik by Median Female Earnings
In terms of median female earnings, the demographic groups most similar to Yup'ik are Pueblo ($32,564, a difference of 0.51%), Lumbee ($32,500, a difference of 0.71%), Navajo ($33,046, a difference of 0.96%), Tohono O'odham ($33,205, a difference of 1.5%), and Immigrants from Mexico ($33,236, a difference of 1.5%).
| Demographics | Rating | Rank | Median Female Earnings |
| Mexicans | 0.0 /100 | #333 | Tragic $33,664 |
| Spanish American Indians | 0.0 /100 | #334 | Tragic $33,625 |
| Creek | 0.0 /100 | #335 | Tragic $33,437 |
| Ottawa | 0.0 /100 | #336 | Tragic $33,378 |
| Yakama | 0.0 /100 | #337 | Tragic $33,354 |
| Immigrants | Cuba | 0.0 /100 | #338 | Tragic $33,291 |
| Immigrants | Mexico | 0.0 /100 | #339 | Tragic $33,236 |
| Tohono O'odham | 0.0 /100 | #340 | Tragic $33,205 |
| Navajo | 0.0 /100 | #341 | Tragic $33,046 |
| Yup'ik | 0.0 /100 | #342 | Tragic $32,730 |
| Pueblo | 0.0 /100 | #343 | Tragic $32,564 |
| Lumbee | 0.0 /100 | #344 | Tragic $32,500 |
| Puerto Ricans | 0.0 /100 | #345 | Tragic $31,560 |
| Arapaho | 0.0 /100 | #346 | Tragic $31,489 |
| Houma | 0.0 /100 | #347 | Tragic $30,343 |
Demographics Similar to Eastern Europeans by Median Female Earnings
In terms of median female earnings, the demographic groups most similar to Eastern Europeans are Immigrants from Japan ($45,323, a difference of 0.14%), Cypriot ($45,570, a difference of 0.41%), Cambodian ($45,014, a difference of 0.82%), Immigrants from Greece ($44,976, a difference of 0.91%), and Burmese ($44,911, a difference of 1.1%).
| Demographics | Rating | Rank | Median Female Earnings |
| Immigrants | Israel | 100.0 /100 | #12 | Exceptional $46,902 |
| Immigrants | Australia | 100.0 /100 | #13 | Exceptional $46,573 |
| Soviet Union | 100.0 /100 | #14 | Exceptional $46,556 |
| Immigrants | Eastern Asia | 100.0 /100 | #15 | Exceptional $46,502 |
| Indians (Asian) | 100.0 /100 | #16 | Exceptional $46,481 |
| Immigrants | South Central Asia | 100.0 /100 | #17 | Exceptional $46,324 |
| Cypriots | 100.0 /100 | #18 | Exceptional $45,570 |
| Eastern Europeans | 100.0 /100 | #19 | Exceptional $45,385 |
| Immigrants | Japan | 100.0 /100 | #20 | Exceptional $45,323 |
| Cambodians | 100.0 /100 | #21 | Exceptional $45,014 |
| Immigrants | Greece | 100.0 /100 | #22 | Exceptional $44,976 |
| Burmese | 100.0 /100 | #23 | Exceptional $44,911 |
| Immigrants | Korea | 100.0 /100 | #24 | Exceptional $44,847 |
| Immigrants | Sweden | 100.0 /100 | #25 | Exceptional $44,774 |
| Immigrants | Belarus | 100.0 /100 | #26 | Exceptional $44,757 |