Black/African American vs Hungarian Single Father Households
COMPARE
Black/African American
Hungarian
Single Father Households
Single Father Households Comparison
Blacks/African Americans
Hungarians
2.4%
SINGLE FATHER HOUSEHOLDS
9.7/ 100
METRIC RATING
226th/ 347
METRIC RANK
2.2%
SINGLE FATHER HOUSEHOLDS
97.9/ 100
METRIC RATING
117th/ 347
METRIC RANK
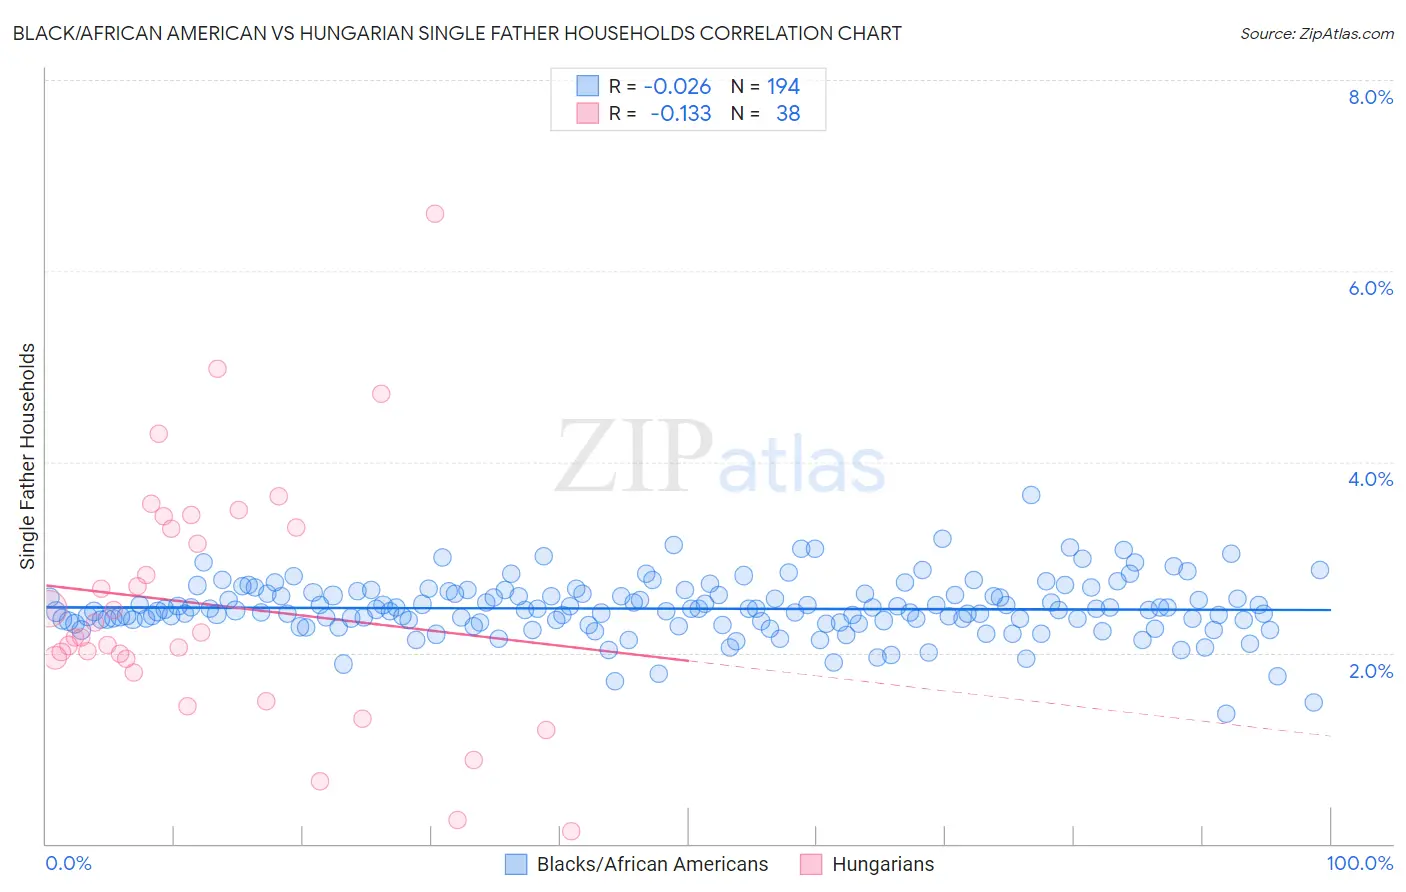
Black/African American vs Hungarian Single Father Households Correlation Chart
The statistical analysis conducted on geographies consisting of 552,512,239 people shows no correlation between the proportion of Blacks/African Americans and percentage of single father households in the United States with a correlation coefficient (R) of -0.026 and weighted average of 2.4%. Similarly, the statistical analysis conducted on geographies consisting of 478,655,062 people shows a poor negative correlation between the proportion of Hungarians and percentage of single father households in the United States with a correlation coefficient (R) of -0.133 and weighted average of 2.2%, a difference of 12.1%.
Single Father Households Correlation Summary
| Measurement | Black/African American | Hungarian |
| Minimum | 1.4% | 0.13% |
| Maximum | 3.7% | 6.6% |
| Range | 2.3% | 6.5% |
| Mean | 2.5% | 2.5% |
| Median | 2.5% | 2.2% |
| Interquartile 25% (IQ1) | 2.3% | 1.9% |
| Interquartile 75% (IQ3) | 2.6% | 3.3% |
| Interquartile Range (IQR) | 0.30% | 1.4% |
| Standard Deviation (Sample) | 0.30% | 1.3% |
| Standard Deviation (Population) | 0.30% | 1.3% |
Similar Demographics by Single Father Households
Demographics Similar to Blacks/African Americans by Single Father Households
In terms of single father households, the demographic groups most similar to Blacks/African Americans are Marshallese (2.4%, a difference of 0.010%), American (2.4%, a difference of 0.070%), Immigrants from Ghana (2.4%, a difference of 0.11%), Immigrants from Bahamas (2.4%, a difference of 0.19%), and Immigrants from Zaire (2.4%, a difference of 0.21%).
| Demographics | Rating | Rank | Single Father Households |
| Sudanese | 13.0 /100 | #219 | Poor 2.4% |
| Ghanaians | 12.9 /100 | #220 | Poor 2.4% |
| Immigrants | Burma/Myanmar | 12.1 /100 | #221 | Poor 2.4% |
| Immigrants | Eastern Africa | 11.9 /100 | #222 | Poor 2.4% |
| Immigrants | Uruguay | 11.0 /100 | #223 | Poor 2.4% |
| Immigrants | Bahamas | 10.6 /100 | #224 | Poor 2.4% |
| Marshallese | 9.7 /100 | #225 | Tragic 2.4% |
| Blacks/African Americans | 9.7 /100 | #226 | Tragic 2.4% |
| Americans | 9.3 /100 | #227 | Tragic 2.4% |
| Immigrants | Ghana | 9.1 /100 | #228 | Tragic 2.4% |
| Immigrants | Zaire | 8.6 /100 | #229 | Tragic 2.4% |
| Sub-Saharan Africans | 8.3 /100 | #230 | Tragic 2.4% |
| Immigrants | Nonimmigrants | 7.6 /100 | #231 | Tragic 2.4% |
| Pennsylvania Germans | 7.3 /100 | #232 | Tragic 2.4% |
| Immigrants | Western Africa | 7.0 /100 | #233 | Tragic 2.4% |
Demographics Similar to Hungarians by Single Father Households
In terms of single father households, the demographic groups most similar to Hungarians are Immigrants from Morocco (2.2%, a difference of 0.10%), Trinidadian and Tobagonian (2.2%, a difference of 0.16%), Immigrants from Argentina (2.2%, a difference of 0.19%), Australian (2.2%, a difference of 0.19%), and Immigrants from Brazil (2.2%, a difference of 0.19%).
| Demographics | Rating | Rank | Single Father Households |
| Italians | 98.3 /100 | #110 | Exceptional 2.2% |
| Immigrants | Canada | 98.3 /100 | #111 | Exceptional 2.2% |
| Immigrants | Trinidad and Tobago | 98.2 /100 | #112 | Exceptional 2.2% |
| Iraqis | 98.2 /100 | #113 | Exceptional 2.2% |
| Immigrants | North America | 98.2 /100 | #114 | Exceptional 2.2% |
| Immigrants | Barbados | 98.2 /100 | #115 | Exceptional 2.2% |
| Immigrants | Argentina | 98.1 /100 | #116 | Exceptional 2.2% |
| Hungarians | 97.9 /100 | #117 | Exceptional 2.2% |
| Immigrants | Morocco | 97.8 /100 | #118 | Exceptional 2.2% |
| Trinidadians and Tobagonians | 97.8 /100 | #119 | Exceptional 2.2% |
| Australians | 97.7 /100 | #120 | Exceptional 2.2% |
| Immigrants | Brazil | 97.7 /100 | #121 | Exceptional 2.2% |
| Immigrants | Iraq | 97.6 /100 | #122 | Exceptional 2.2% |
| Immigrants | Yemen | 97.5 /100 | #123 | Exceptional 2.2% |
| British West Indians | 97.4 /100 | #124 | Exceptional 2.2% |