Yuman vs Thai Births to Unmarried Women
COMPARE
Yuman
Thai
Births to Unmarried Women
Births to Unmarried Women Comparison
Yuman
Thais
44.4%
BIRTHS TO UNMARRIED WOMEN
0.0/ 100
METRIC RATING
334th/ 347
METRIC RANK
24.0%
BIRTHS TO UNMARRIED WOMEN
100.0/ 100
METRIC RATING
7th/ 347
METRIC RANK
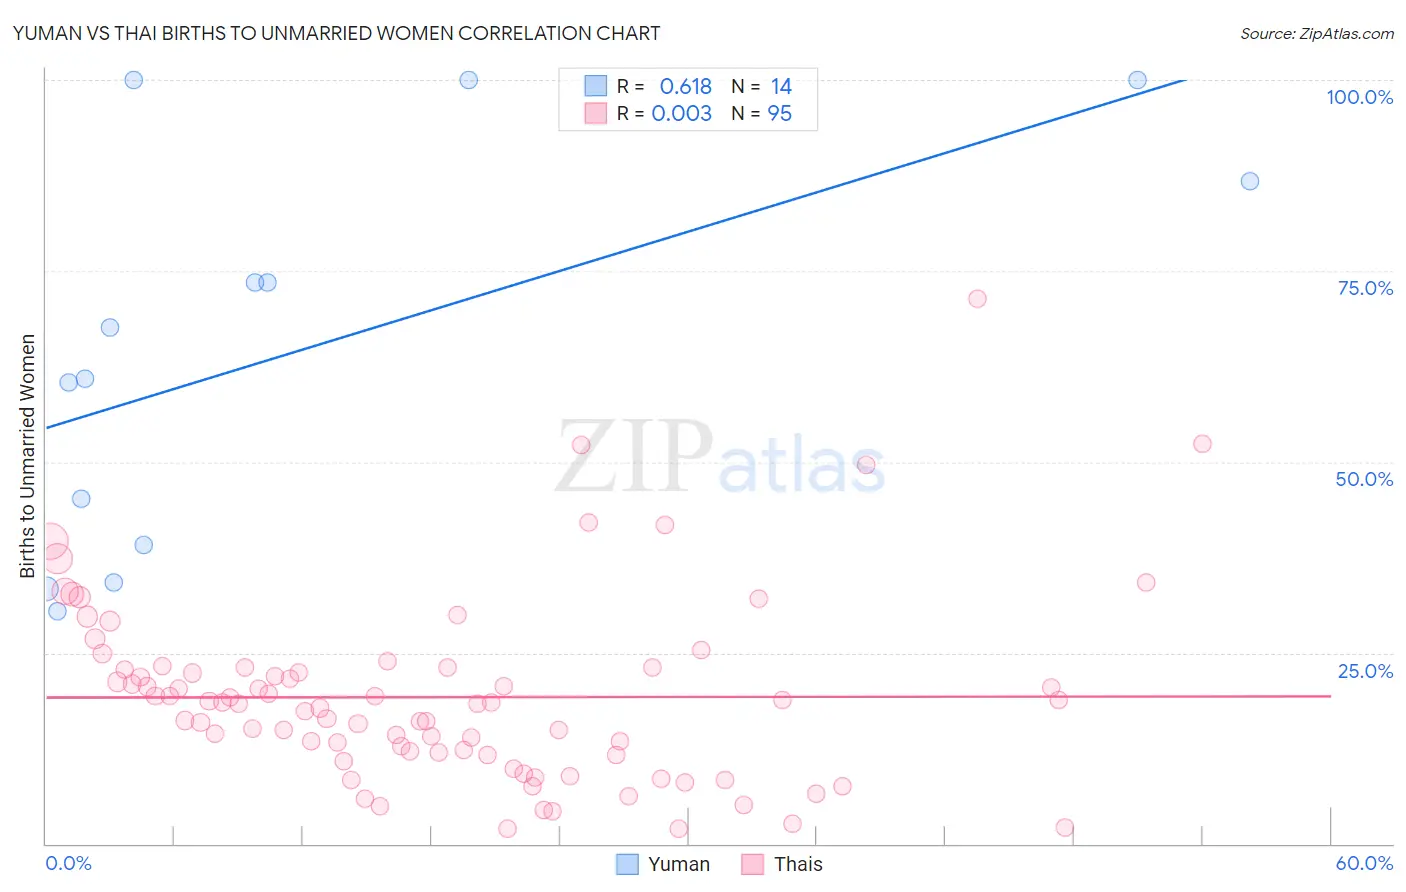
Yuman vs Thai Births to Unmarried Women Correlation Chart
The statistical analysis conducted on geographies consisting of 40,299,721 people shows a significant positive correlation between the proportion of Yuman and percentage of births to unmarried women in the United States with a correlation coefficient (R) of 0.618 and weighted average of 44.4%. Similarly, the statistical analysis conducted on geographies consisting of 438,559,293 people shows no correlation between the proportion of Thais and percentage of births to unmarried women in the United States with a correlation coefficient (R) of 0.003 and weighted average of 24.0%, a difference of 84.7%.
Births to Unmarried Women Correlation Summary
| Measurement | Yuman | Thai |
| Minimum | 30.5% | 1.9% |
| Maximum | 100.0% | 71.3% |
| Range | 69.5% | 69.4% |
| Mean | 64.7% | 19.2% |
| Median | 64.3% | 18.4% |
| Interquartile 25% (IQ1) | 39.1% | 11.7% |
| Interquartile 75% (IQ3) | 86.7% | 23.1% |
| Interquartile Range (IQR) | 47.6% | 11.4% |
| Standard Deviation (Sample) | 25.6% | 12.0% |
| Standard Deviation (Population) | 24.7% | 11.9% |
Similar Demographics by Births to Unmarried Women
Demographics Similar to Yuman by Births to Unmarried Women
In terms of births to unmarried women, the demographic groups most similar to Yuman are Black/African American (44.3%, a difference of 0.17%), Colville (45.3%, a difference of 2.1%), Kiowa (43.1%, a difference of 2.9%), Puerto Rican (45.7%, a difference of 2.9%), and Native/Alaskan (43.0%, a difference of 3.2%).
| Demographics | Rating | Rank | Births to Unmarried Women |
| Tsimshian | 0.0 /100 | #327 | Tragic 42.2% |
| Immigrants | Cabo Verde | 0.0 /100 | #328 | Tragic 42.2% |
| Paiute | 0.0 /100 | #329 | Tragic 42.5% |
| Chippewa | 0.0 /100 | #330 | Tragic 42.6% |
| Natives/Alaskans | 0.0 /100 | #331 | Tragic 43.0% |
| Kiowa | 0.0 /100 | #332 | Tragic 43.1% |
| Blacks/African Americans | 0.0 /100 | #333 | Tragic 44.3% |
| Yuman | 0.0 /100 | #334 | Tragic 44.4% |
| Colville | 0.0 /100 | #335 | Tragic 45.3% |
| Puerto Ricans | 0.0 /100 | #336 | Tragic 45.7% |
| Houma | 0.0 /100 | #337 | Tragic 46.6% |
| Arapaho | 0.0 /100 | #338 | Tragic 47.1% |
| Lumbee | 0.0 /100 | #339 | Tragic 48.2% |
| Tohono O'odham | 0.0 /100 | #340 | Tragic 49.8% |
| Hopi | 0.0 /100 | #341 | Tragic 50.8% |
Demographics Similar to Thais by Births to Unmarried Women
In terms of births to unmarried women, the demographic groups most similar to Thais are Immigrants from Iran (24.0%, a difference of 0.29%), Immigrants from Hong Kong (23.6%, a difference of 1.9%), Immigrants from China (24.7%, a difference of 2.7%), Immigrants from South Central Asia (24.7%, a difference of 2.7%), and Immigrants from Eastern Asia (25.0%, a difference of 4.2%).
| Demographics | Rating | Rank | Births to Unmarried Women |
| Assyrians/Chaldeans/Syriacs | 100.0 /100 | #1 | Exceptional 22.0% |
| Immigrants | India | 100.0 /100 | #2 | Exceptional 22.9% |
| Filipinos | 100.0 /100 | #3 | Exceptional 23.0% |
| Immigrants | Taiwan | 100.0 /100 | #4 | Exceptional 23.0% |
| Immigrants | Hong Kong | 100.0 /100 | #5 | Exceptional 23.6% |
| Immigrants | Iran | 100.0 /100 | #6 | Exceptional 24.0% |
| Thais | 100.0 /100 | #7 | Exceptional 24.0% |
| Immigrants | China | 100.0 /100 | #8 | Exceptional 24.7% |
| Immigrants | South Central Asia | 100.0 /100 | #9 | Exceptional 24.7% |
| Immigrants | Eastern Asia | 100.0 /100 | #10 | Exceptional 25.0% |
| Immigrants | Israel | 100.0 /100 | #11 | Exceptional 25.1% |
| Indians (Asian) | 100.0 /100 | #12 | Exceptional 25.3% |
| Iranians | 100.0 /100 | #13 | Exceptional 25.3% |
| Immigrants | Lebanon | 100.0 /100 | #14 | Exceptional 25.3% |
| Immigrants | Singapore | 100.0 /100 | #15 | Exceptional 25.6% |