Yuman vs Guatemalan Births to Unmarried Women
COMPARE
Yuman
Guatemalan
Births to Unmarried Women
Births to Unmarried Women Comparison
Yuman
Guatemalans
44.4%
BIRTHS TO UNMARRIED WOMEN
0.0/ 100
METRIC RATING
334th/ 347
METRIC RANK
37.1%
BIRTHS TO UNMARRIED WOMEN
0.1/ 100
METRIC RATING
277th/ 347
METRIC RANK
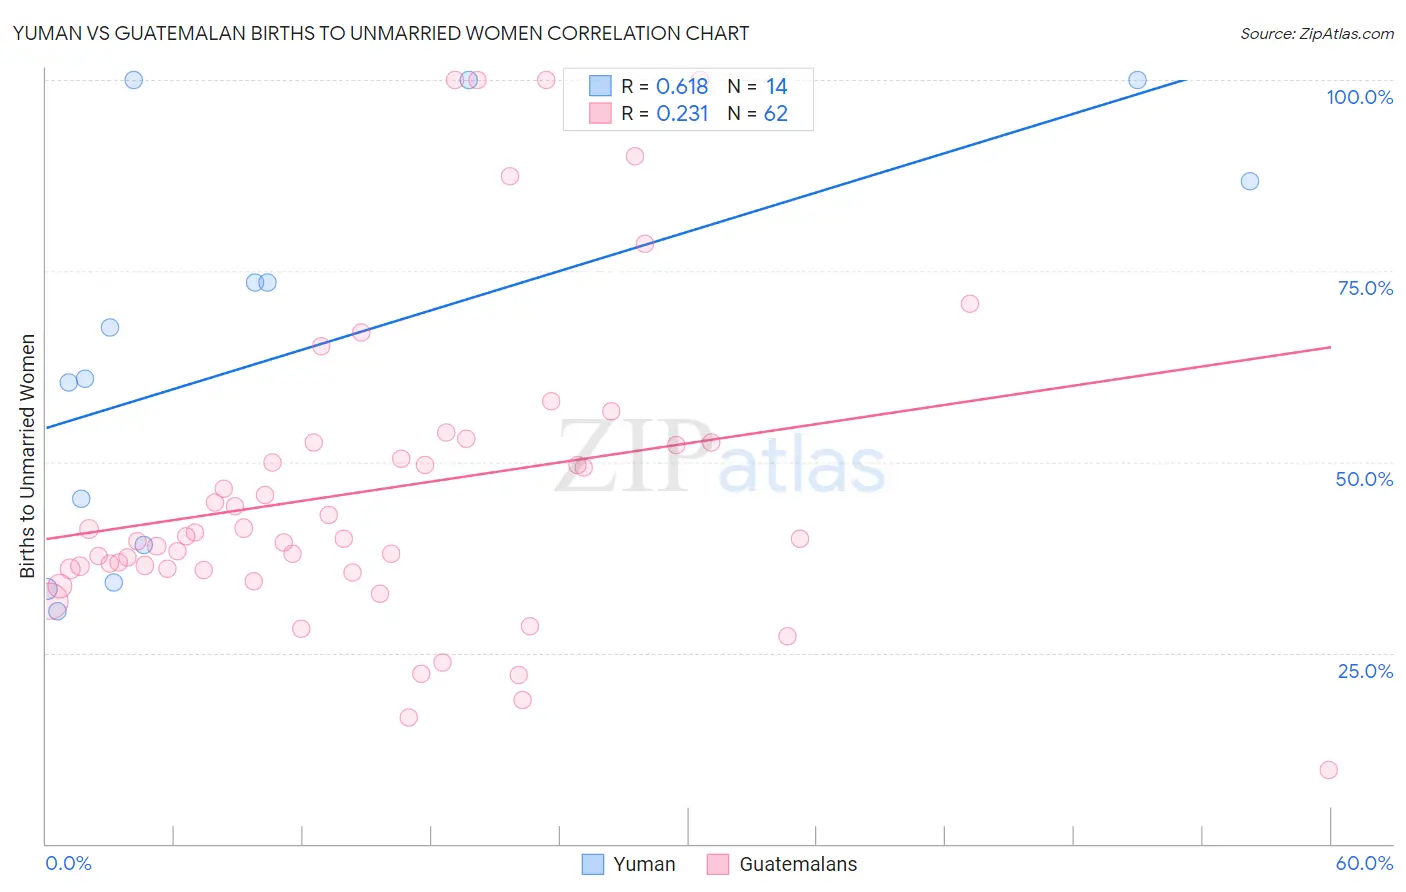
Yuman vs Guatemalan Births to Unmarried Women Correlation Chart
The statistical analysis conducted on geographies consisting of 40,299,721 people shows a significant positive correlation between the proportion of Yuman and percentage of births to unmarried women in the United States with a correlation coefficient (R) of 0.618 and weighted average of 44.4%. Similarly, the statistical analysis conducted on geographies consisting of 386,480,931 people shows a weak positive correlation between the proportion of Guatemalans and percentage of births to unmarried women in the United States with a correlation coefficient (R) of 0.231 and weighted average of 37.1%, a difference of 19.6%.
Births to Unmarried Women Correlation Summary
| Measurement | Yuman | Guatemalan |
| Minimum | 30.5% | 9.7% |
| Maximum | 100.0% | 100.0% |
| Range | 69.5% | 90.3% |
| Mean | 64.7% | 46.5% |
| Median | 64.3% | 40.1% |
| Interquartile 25% (IQ1) | 39.1% | 35.9% |
| Interquartile 75% (IQ3) | 86.7% | 52.6% |
| Interquartile Range (IQR) | 47.6% | 16.7% |
| Standard Deviation (Sample) | 25.6% | 20.6% |
| Standard Deviation (Population) | 24.7% | 20.5% |
Similar Demographics by Births to Unmarried Women
Demographics Similar to Yuman by Births to Unmarried Women
In terms of births to unmarried women, the demographic groups most similar to Yuman are Black/African American (44.3%, a difference of 0.17%), Colville (45.3%, a difference of 2.1%), Kiowa (43.1%, a difference of 2.9%), Puerto Rican (45.7%, a difference of 2.9%), and Native/Alaskan (43.0%, a difference of 3.2%).
| Demographics | Rating | Rank | Births to Unmarried Women |
| Tsimshian | 0.0 /100 | #327 | Tragic 42.2% |
| Immigrants | Cabo Verde | 0.0 /100 | #328 | Tragic 42.2% |
| Paiute | 0.0 /100 | #329 | Tragic 42.5% |
| Chippewa | 0.0 /100 | #330 | Tragic 42.6% |
| Natives/Alaskans | 0.0 /100 | #331 | Tragic 43.0% |
| Kiowa | 0.0 /100 | #332 | Tragic 43.1% |
| Blacks/African Americans | 0.0 /100 | #333 | Tragic 44.3% |
| Yuman | 0.0 /100 | #334 | Tragic 44.4% |
| Colville | 0.0 /100 | #335 | Tragic 45.3% |
| Puerto Ricans | 0.0 /100 | #336 | Tragic 45.7% |
| Houma | 0.0 /100 | #337 | Tragic 46.6% |
| Arapaho | 0.0 /100 | #338 | Tragic 47.1% |
| Lumbee | 0.0 /100 | #339 | Tragic 48.2% |
| Tohono O'odham | 0.0 /100 | #340 | Tragic 49.8% |
| Hopi | 0.0 /100 | #341 | Tragic 50.8% |
Demographics Similar to Guatemalans by Births to Unmarried Women
In terms of births to unmarried women, the demographic groups most similar to Guatemalans are Immigrants from Latin America (37.1%, a difference of 0.090%), Belizean (37.0%, a difference of 0.22%), Barbadian (37.0%, a difference of 0.41%), West Indian (37.3%, a difference of 0.42%), and Cree (37.0%, a difference of 0.43%).
| Demographics | Rating | Rank | Births to Unmarried Women |
| Immigrants | Congo | 0.1 /100 | #270 | Tragic 36.8% |
| Immigrants | Barbados | 0.1 /100 | #271 | Tragic 36.8% |
| Choctaw | 0.1 /100 | #272 | Tragic 36.9% |
| Mexicans | 0.1 /100 | #273 | Tragic 36.9% |
| Cree | 0.1 /100 | #274 | Tragic 37.0% |
| Barbadians | 0.1 /100 | #275 | Tragic 37.0% |
| Belizeans | 0.1 /100 | #276 | Tragic 37.0% |
| Guatemalans | 0.1 /100 | #277 | Tragic 37.1% |
| Immigrants | Latin America | 0.1 /100 | #278 | Tragic 37.1% |
| West Indians | 0.1 /100 | #279 | Tragic 37.3% |
| Immigrants | St. Vincent and the Grenadines | 0.1 /100 | #280 | Tragic 37.3% |
| Immigrants | Belize | 0.1 /100 | #281 | Tragic 37.3% |
| Liberians | 0.0 /100 | #282 | Tragic 37.4% |
| Spanish American Indians | 0.0 /100 | #283 | Tragic 37.4% |
| Immigrants | Central America | 0.0 /100 | #284 | Tragic 37.4% |