African vs Thai Births to Unmarried Women
COMPARE
African
Thai
Births to Unmarried Women
Births to Unmarried Women Comparison
Africans
Thais
39.7%
BIRTHS TO UNMARRIED WOMEN
0.0/ 100
METRIC RATING
313th/ 347
METRIC RANK
24.0%
BIRTHS TO UNMARRIED WOMEN
100.0/ 100
METRIC RATING
7th/ 347
METRIC RANK
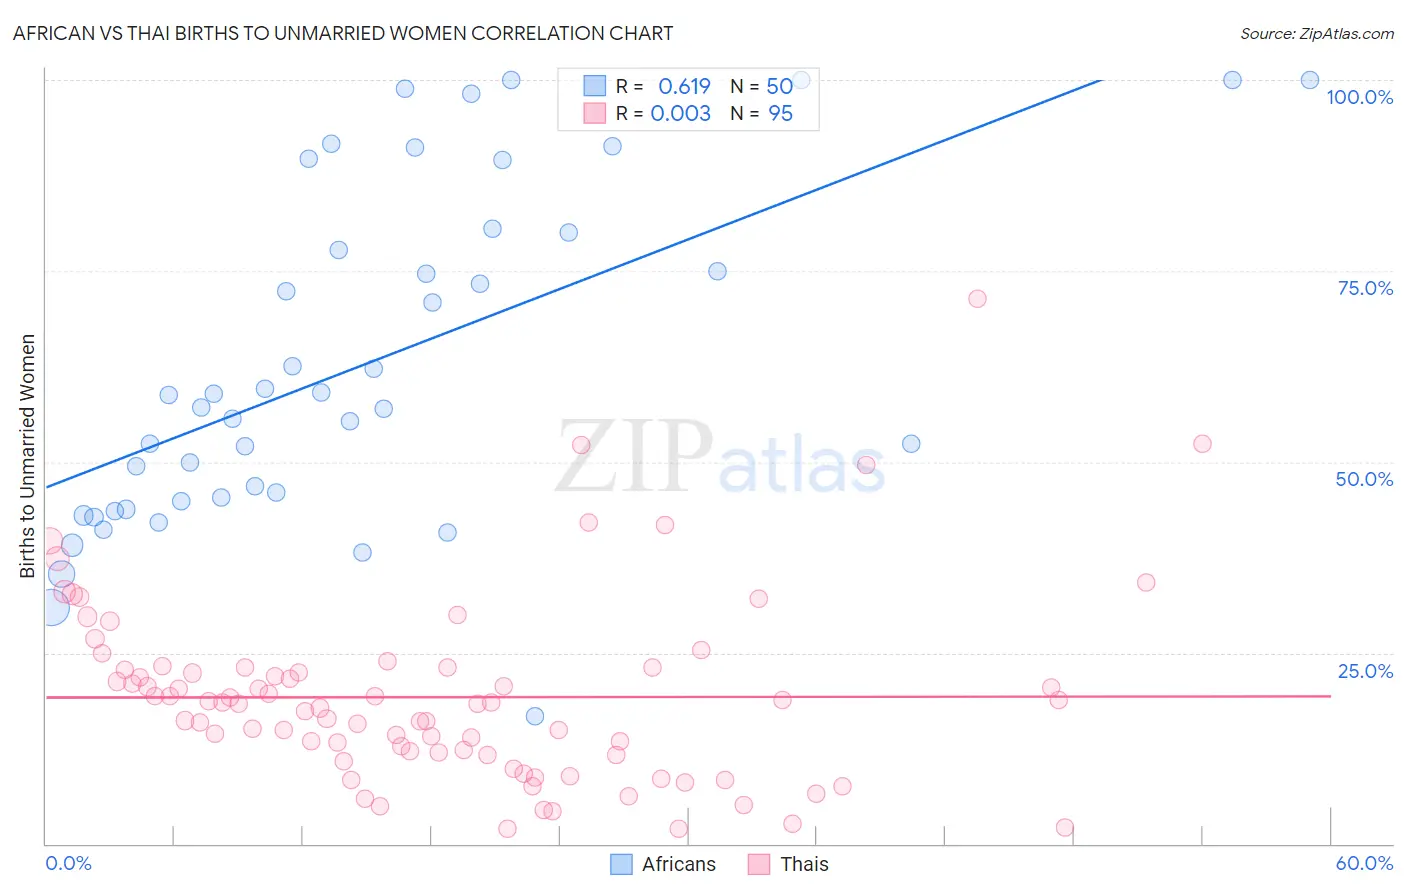
African vs Thai Births to Unmarried Women Correlation Chart
The statistical analysis conducted on geographies consisting of 441,094,668 people shows a significant positive correlation between the proportion of Africans and percentage of births to unmarried women in the United States with a correlation coefficient (R) of 0.619 and weighted average of 39.7%. Similarly, the statistical analysis conducted on geographies consisting of 438,559,293 people shows no correlation between the proportion of Thais and percentage of births to unmarried women in the United States with a correlation coefficient (R) of 0.003 and weighted average of 24.0%, a difference of 65.3%.
Births to Unmarried Women Correlation Summary
| Measurement | African | Thai |
| Minimum | 16.7% | 1.9% |
| Maximum | 100.0% | 71.3% |
| Range | 83.3% | 69.4% |
| Mean | 62.7% | 19.2% |
| Median | 58.0% | 18.4% |
| Interquartile 25% (IQ1) | 44.9% | 11.7% |
| Interquartile 75% (IQ3) | 80.0% | 23.1% |
| Interquartile Range (IQR) | 35.1% | 11.4% |
| Standard Deviation (Sample) | 21.9% | 12.0% |
| Standard Deviation (Population) | 21.6% | 11.9% |
Similar Demographics by Births to Unmarried Women
Demographics Similar to Africans by Births to Unmarried Women
In terms of births to unmarried women, the demographic groups most similar to Africans are Immigrants from Caribbean (39.8%, a difference of 0.29%), Dominican (39.8%, a difference of 0.33%), U.S. Virgin Islander (39.6%, a difference of 0.34%), Immigrants from the Azores (39.6%, a difference of 0.36%), and Apache (39.9%, a difference of 0.38%).
| Demographics | Rating | Rank | Births to Unmarried Women |
| Central American Indians | 0.0 /100 | #306 | Tragic 39.0% |
| Immigrants | Honduras | 0.0 /100 | #307 | Tragic 39.3% |
| Aleuts | 0.0 /100 | #308 | Tragic 39.3% |
| Cubans | 0.0 /100 | #309 | Tragic 39.4% |
| Immigrants | Dominica | 0.0 /100 | #310 | Tragic 39.5% |
| Immigrants | Azores | 0.0 /100 | #311 | Tragic 39.6% |
| U.S. Virgin Islanders | 0.0 /100 | #312 | Tragic 39.6% |
| Africans | 0.0 /100 | #313 | Tragic 39.7% |
| Immigrants | Caribbean | 0.0 /100 | #314 | Tragic 39.8% |
| Dominicans | 0.0 /100 | #315 | Tragic 39.8% |
| Apache | 0.0 /100 | #316 | Tragic 39.9% |
| Immigrants | Dominican Republic | 0.0 /100 | #317 | Tragic 40.1% |
| Immigrants | Bahamas | 0.0 /100 | #318 | Tragic 40.1% |
| Yakama | 0.0 /100 | #319 | Tragic 40.3% |
| Crow | 0.0 /100 | #320 | Tragic 40.4% |
Demographics Similar to Thais by Births to Unmarried Women
In terms of births to unmarried women, the demographic groups most similar to Thais are Immigrants from Iran (24.0%, a difference of 0.29%), Immigrants from Hong Kong (23.6%, a difference of 1.9%), Immigrants from China (24.7%, a difference of 2.7%), Immigrants from South Central Asia (24.7%, a difference of 2.7%), and Immigrants from Eastern Asia (25.0%, a difference of 4.2%).
| Demographics | Rating | Rank | Births to Unmarried Women |
| Assyrians/Chaldeans/Syriacs | 100.0 /100 | #1 | Exceptional 22.0% |
| Immigrants | India | 100.0 /100 | #2 | Exceptional 22.9% |
| Filipinos | 100.0 /100 | #3 | Exceptional 23.0% |
| Immigrants | Taiwan | 100.0 /100 | #4 | Exceptional 23.0% |
| Immigrants | Hong Kong | 100.0 /100 | #5 | Exceptional 23.6% |
| Immigrants | Iran | 100.0 /100 | #6 | Exceptional 24.0% |
| Thais | 100.0 /100 | #7 | Exceptional 24.0% |
| Immigrants | China | 100.0 /100 | #8 | Exceptional 24.7% |
| Immigrants | South Central Asia | 100.0 /100 | #9 | Exceptional 24.7% |
| Immigrants | Eastern Asia | 100.0 /100 | #10 | Exceptional 25.0% |
| Immigrants | Israel | 100.0 /100 | #11 | Exceptional 25.1% |
| Indians (Asian) | 100.0 /100 | #12 | Exceptional 25.3% |
| Iranians | 100.0 /100 | #13 | Exceptional 25.3% |
| Immigrants | Lebanon | 100.0 /100 | #14 | Exceptional 25.3% |
| Immigrants | Singapore | 100.0 /100 | #15 | Exceptional 25.6% |