Immigrants from Bolivia vs Thai Births to Unmarried Women
COMPARE
Immigrants from Bolivia
Thai
Births to Unmarried Women
Births to Unmarried Women Comparison
Immigrants from Bolivia
Thais
28.6%
BIRTHS TO UNMARRIED WOMEN
98.5/ 100
METRIC RATING
74th/ 347
METRIC RANK
24.0%
BIRTHS TO UNMARRIED WOMEN
100.0/ 100
METRIC RATING
7th/ 347
METRIC RANK
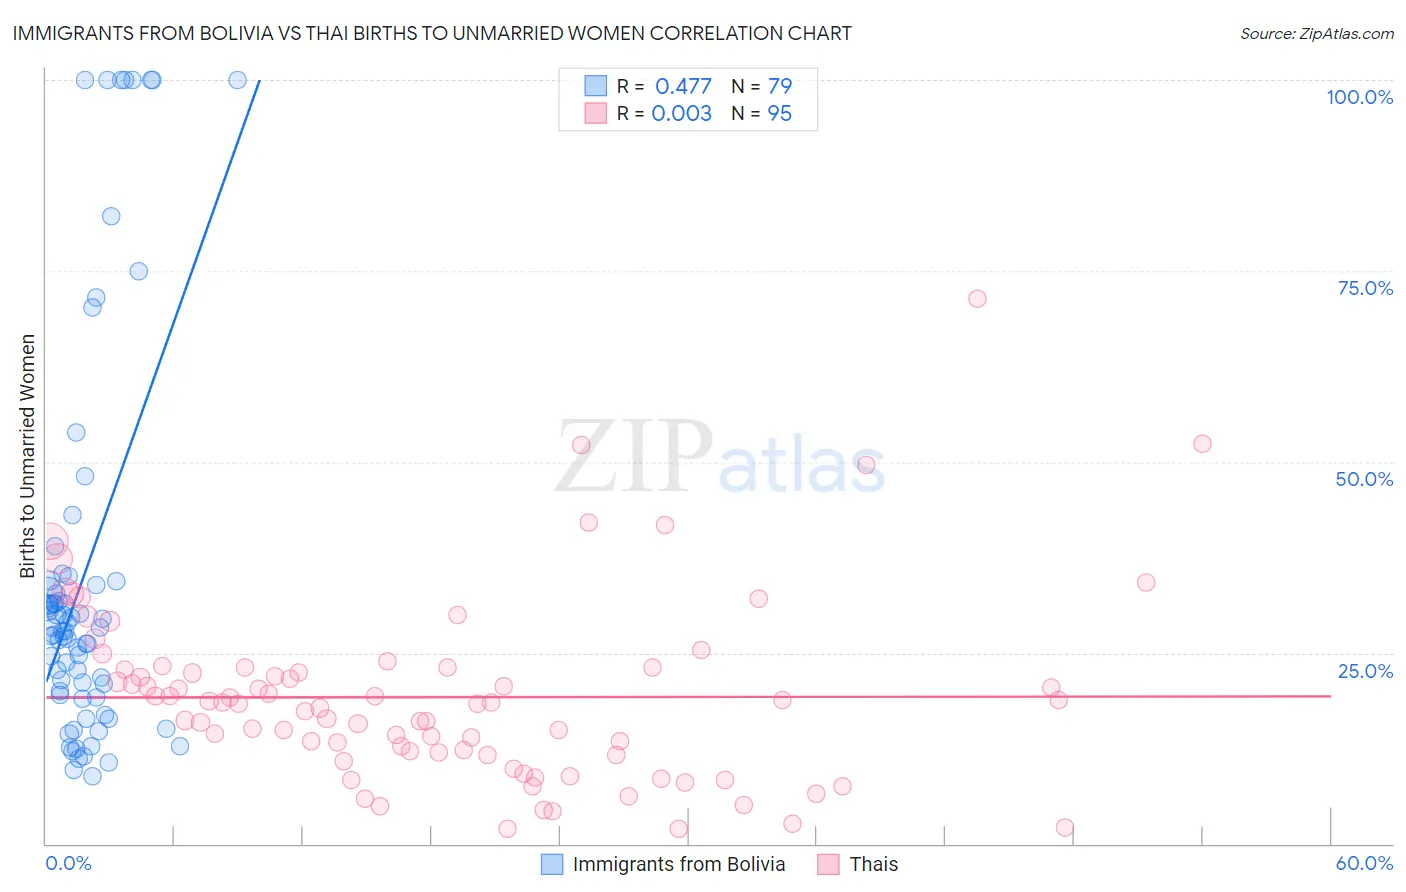
Immigrants from Bolivia vs Thai Births to Unmarried Women Correlation Chart
The statistical analysis conducted on geographies consisting of 153,801,306 people shows a moderate positive correlation between the proportion of Immigrants from Bolivia and percentage of births to unmarried women in the United States with a correlation coefficient (R) of 0.477 and weighted average of 28.6%. Similarly, the statistical analysis conducted on geographies consisting of 438,559,293 people shows no correlation between the proportion of Thais and percentage of births to unmarried women in the United States with a correlation coefficient (R) of 0.003 and weighted average of 24.0%, a difference of 18.9%.
Births to Unmarried Women Correlation Summary
| Measurement | Immigrants from Bolivia | Thai |
| Minimum | 8.9% | 1.9% |
| Maximum | 100.0% | 71.3% |
| Range | 91.1% | 69.4% |
| Mean | 35.2% | 19.2% |
| Median | 27.9% | 18.4% |
| Interquartile 25% (IQ1) | 19.4% | 11.7% |
| Interquartile 75% (IQ3) | 34.4% | 23.1% |
| Interquartile Range (IQR) | 15.0% | 11.4% |
| Standard Deviation (Sample) | 25.9% | 12.0% |
| Standard Deviation (Population) | 25.8% | 11.9% |
Similar Demographics by Births to Unmarried Women
Demographics Similar to Immigrants from Bolivia by Births to Unmarried Women
In terms of births to unmarried women, the demographic groups most similar to Immigrants from Bolivia are Albanian (28.5%, a difference of 0.020%), Immigrants from Sweden (28.5%, a difference of 0.070%), Immigrants from Switzerland (28.6%, a difference of 0.090%), Israeli (28.6%, a difference of 0.10%), and Jordanian (28.5%, a difference of 0.13%).
| Demographics | Rating | Rank | Births to Unmarried Women |
| Palestinians | 98.7 /100 | #67 | Exceptional 28.4% |
| Immigrants | Europe | 98.7 /100 | #68 | Exceptional 28.4% |
| Bolivians | 98.7 /100 | #69 | Exceptional 28.5% |
| Laotians | 98.6 /100 | #70 | Exceptional 28.5% |
| Jordanians | 98.5 /100 | #71 | Exceptional 28.5% |
| Immigrants | Sweden | 98.5 /100 | #72 | Exceptional 28.5% |
| Albanians | 98.5 /100 | #73 | Exceptional 28.5% |
| Immigrants | Bolivia | 98.5 /100 | #74 | Exceptional 28.6% |
| Immigrants | Switzerland | 98.4 /100 | #75 | Exceptional 28.6% |
| Israelis | 98.4 /100 | #76 | Exceptional 28.6% |
| Immigrants | Northern Europe | 98.3 /100 | #77 | Exceptional 28.6% |
| Zimbabweans | 98.2 /100 | #78 | Exceptional 28.7% |
| Danes | 98.2 /100 | #79 | Exceptional 28.7% |
| Immigrants | Afghanistan | 98.1 /100 | #80 | Exceptional 28.7% |
| Immigrants | Austria | 98.1 /100 | #81 | Exceptional 28.7% |
Demographics Similar to Thais by Births to Unmarried Women
In terms of births to unmarried women, the demographic groups most similar to Thais are Immigrants from Iran (24.0%, a difference of 0.29%), Immigrants from Hong Kong (23.6%, a difference of 1.9%), Immigrants from China (24.7%, a difference of 2.7%), Immigrants from South Central Asia (24.7%, a difference of 2.7%), and Immigrants from Eastern Asia (25.0%, a difference of 4.2%).
| Demographics | Rating | Rank | Births to Unmarried Women |
| Assyrians/Chaldeans/Syriacs | 100.0 /100 | #1 | Exceptional 22.0% |
| Immigrants | India | 100.0 /100 | #2 | Exceptional 22.9% |
| Filipinos | 100.0 /100 | #3 | Exceptional 23.0% |
| Immigrants | Taiwan | 100.0 /100 | #4 | Exceptional 23.0% |
| Immigrants | Hong Kong | 100.0 /100 | #5 | Exceptional 23.6% |
| Immigrants | Iran | 100.0 /100 | #6 | Exceptional 24.0% |
| Thais | 100.0 /100 | #7 | Exceptional 24.0% |
| Immigrants | China | 100.0 /100 | #8 | Exceptional 24.7% |
| Immigrants | South Central Asia | 100.0 /100 | #9 | Exceptional 24.7% |
| Immigrants | Eastern Asia | 100.0 /100 | #10 | Exceptional 25.0% |
| Immigrants | Israel | 100.0 /100 | #11 | Exceptional 25.1% |
| Indians (Asian) | 100.0 /100 | #12 | Exceptional 25.3% |
| Iranians | 100.0 /100 | #13 | Exceptional 25.3% |
| Immigrants | Lebanon | 100.0 /100 | #14 | Exceptional 25.3% |
| Immigrants | Singapore | 100.0 /100 | #15 | Exceptional 25.6% |