Yuman vs Thai Female Poverty Among 25-34 Year Olds
COMPARE
Yuman
Thai
Female Poverty Among 25-34 Year Olds
Female Poverty Among 25-34 Year Olds Comparison
Yuman
Thais
22.9%
FEMALE POVERTY AMONG 25-34 YEAR OLDS
0.0/ 100
METRIC RATING
339th/ 347
METRIC RANK
10.2%
FEMALE POVERTY AMONG 25-34 YEAR OLDS
100.0/ 100
METRIC RATING
4th/ 347
METRIC RANK
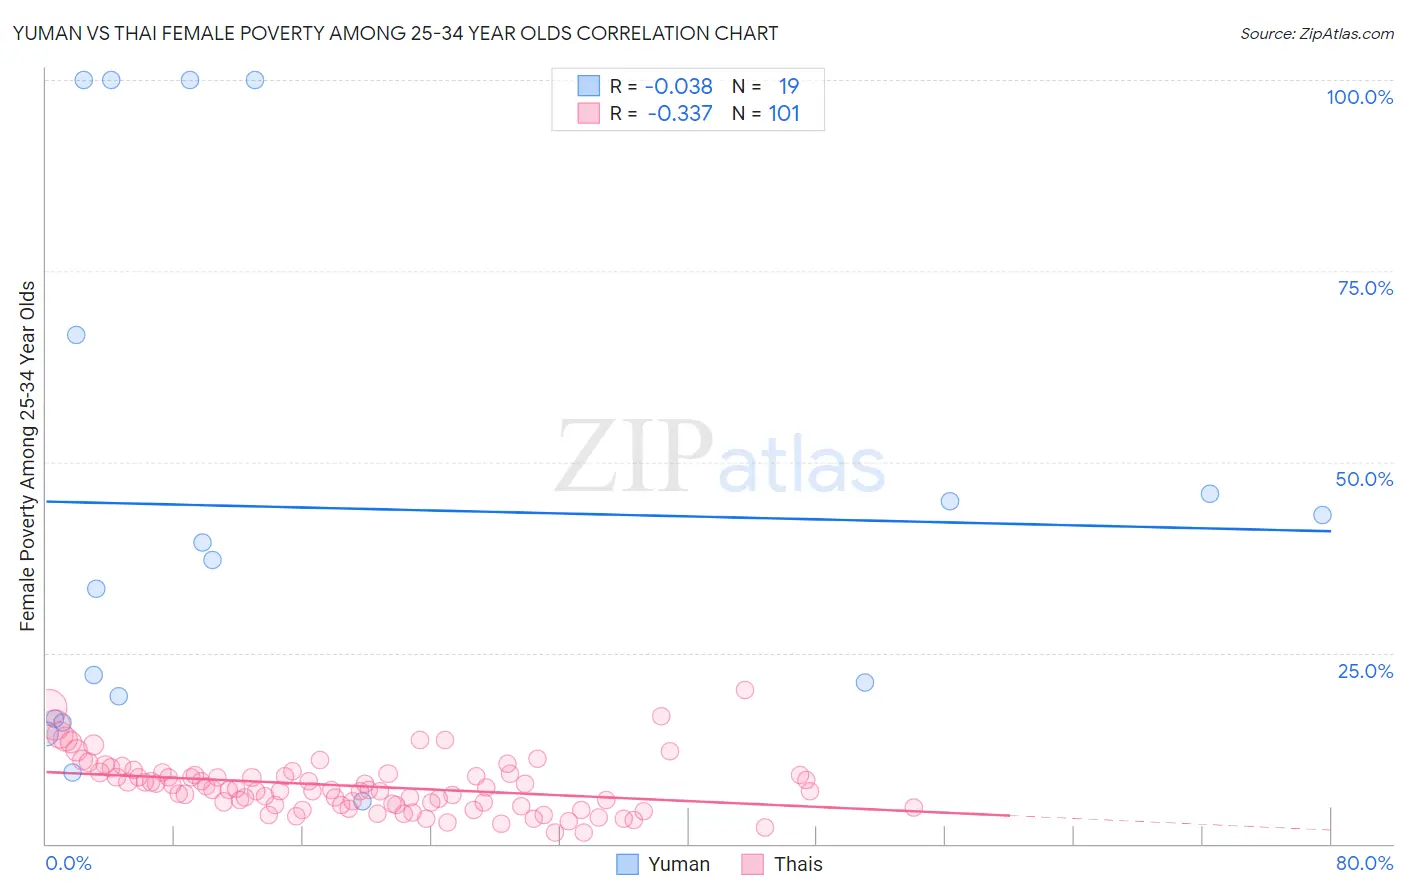
Yuman vs Thai Female Poverty Among 25-34 Year Olds Correlation Chart
The statistical analysis conducted on geographies consisting of 40,634,660 people shows no correlation between the proportion of Yuman and poverty level among females between the ages 25 and 34 in the United States with a correlation coefficient (R) of -0.038 and weighted average of 22.9%. Similarly, the statistical analysis conducted on geographies consisting of 465,466,782 people shows a mild negative correlation between the proportion of Thais and poverty level among females between the ages 25 and 34 in the United States with a correlation coefficient (R) of -0.337 and weighted average of 10.2%, a difference of 124.0%.
Female Poverty Among 25-34 Year Olds Correlation Summary
| Measurement | Yuman | Thai |
| Minimum | 5.6% | 1.4% |
| Maximum | 100.0% | 20.1% |
| Range | 94.4% | 18.6% |
| Mean | 43.9% | 7.6% |
| Median | 37.2% | 7.1% |
| Interquartile 25% (IQ1) | 16.4% | 5.1% |
| Interquartile 75% (IQ3) | 66.7% | 9.2% |
| Interquartile Range (IQR) | 50.3% | 4.1% |
| Standard Deviation (Sample) | 33.3% | 3.5% |
| Standard Deviation (Population) | 32.4% | 3.5% |
Similar Demographics by Female Poverty Among 25-34 Year Olds
Demographics Similar to Yuman by Female Poverty Among 25-34 Year Olds
In terms of female poverty among 25-34 year olds, the demographic groups most similar to Yuman are Sioux (23.0%, a difference of 0.18%), Houma (22.7%, a difference of 0.85%), Crow (22.7%, a difference of 1.0%), Navajo (23.3%, a difference of 1.9%), and Hopi (23.7%, a difference of 3.3%).
| Demographics | Rating | Rank | Female Poverty Among 25-34 Year Olds |
| Immigrants | Yemen | 0.0 /100 | #332 | Tragic 19.8% |
| Cajuns | 0.0 /100 | #333 | Tragic 19.9% |
| Apache | 0.0 /100 | #334 | Tragic 20.1% |
| Natives/Alaskans | 0.0 /100 | #335 | Tragic 20.3% |
| Pueblo | 0.0 /100 | #336 | Tragic 22.2% |
| Crow | 0.0 /100 | #337 | Tragic 22.7% |
| Houma | 0.0 /100 | #338 | Tragic 22.7% |
| Yuman | 0.0 /100 | #339 | Tragic 22.9% |
| Sioux | 0.0 /100 | #340 | Tragic 23.0% |
| Navajo | 0.0 /100 | #341 | Tragic 23.3% |
| Hopi | 0.0 /100 | #342 | Tragic 23.7% |
| Yup'ik | 0.0 /100 | #343 | Tragic 24.3% |
| Tohono O'odham | 0.0 /100 | #344 | Tragic 24.7% |
| Pima | 0.0 /100 | #345 | Tragic 25.3% |
| Lumbee | 0.0 /100 | #346 | Tragic 26.3% |
Demographics Similar to Thais by Female Poverty Among 25-34 Year Olds
In terms of female poverty among 25-34 year olds, the demographic groups most similar to Thais are Filipino (10.2%, a difference of 0.17%), Immigrants from Hong Kong (10.4%, a difference of 1.4%), Immigrants from Taiwan (10.0%, a difference of 2.2%), Immigrants from South Central Asia (10.8%, a difference of 5.1%), and Immigrants from India (9.7%, a difference of 5.4%).
| Demographics | Rating | Rank | Female Poverty Among 25-34 Year Olds |
| Immigrants | India | 100.0 /100 | #1 | Exceptional 9.7% |
| Immigrants | Taiwan | 100.0 /100 | #2 | Exceptional 10.0% |
| Filipinos | 100.0 /100 | #3 | Exceptional 10.2% |
| Thais | 100.0 /100 | #4 | Exceptional 10.2% |
| Immigrants | Hong Kong | 100.0 /100 | #5 | Exceptional 10.4% |
| Immigrants | South Central Asia | 100.0 /100 | #6 | Exceptional 10.8% |
| Chinese | 100.0 /100 | #7 | Exceptional 11.0% |
| Immigrants | Iran | 100.0 /100 | #8 | Exceptional 11.0% |
| Immigrants | Singapore | 100.0 /100 | #9 | Exceptional 11.1% |
| Immigrants | Lithuania | 100.0 /100 | #10 | Exceptional 11.1% |
| Immigrants | Korea | 100.0 /100 | #11 | Exceptional 11.1% |
| Immigrants | Ireland | 100.0 /100 | #12 | Exceptional 11.2% |
| Burmese | 100.0 /100 | #13 | Exceptional 11.2% |
| Indians (Asian) | 100.0 /100 | #14 | Exceptional 11.2% |
| Assyrians/Chaldeans/Syriacs | 100.0 /100 | #15 | Exceptional 11.2% |