Yuman vs Arab Births to Unmarried Women
COMPARE
Yuman
Arab
Births to Unmarried Women
Births to Unmarried Women Comparison
Yuman
Arabs
44.4%
BIRTHS TO UNMARRIED WOMEN
0.0/ 100
METRIC RATING
334th/ 347
METRIC RANK
29.2%
BIRTHS TO UNMARRIED WOMEN
96.5/ 100
METRIC RATING
92nd/ 347
METRIC RANK
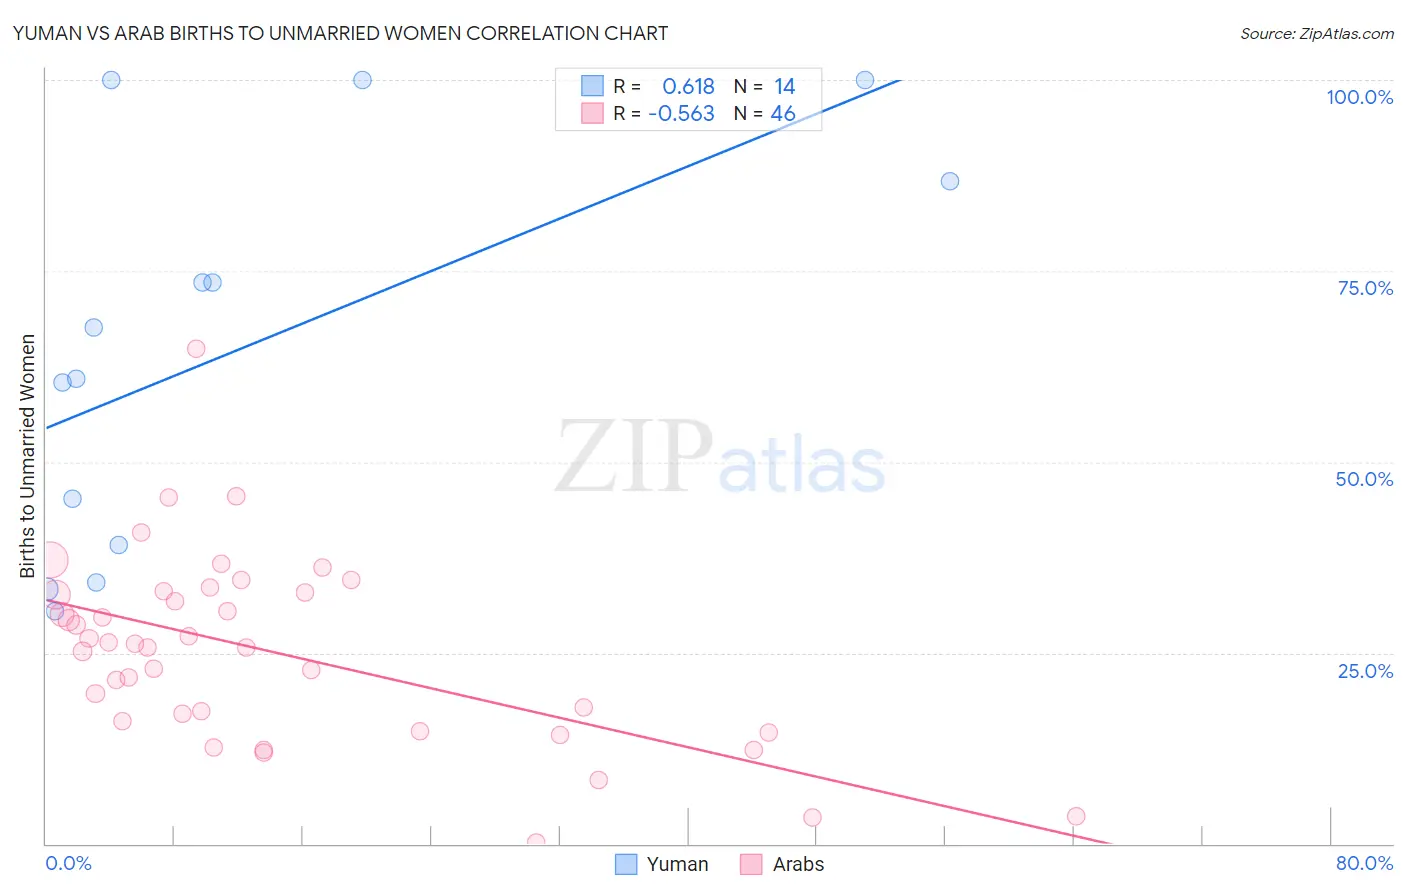
Yuman vs Arab Births to Unmarried Women Correlation Chart
The statistical analysis conducted on geographies consisting of 40,299,721 people shows a significant positive correlation between the proportion of Yuman and percentage of births to unmarried women in the United States with a correlation coefficient (R) of 0.618 and weighted average of 44.4%. Similarly, the statistical analysis conducted on geographies consisting of 447,045,945 people shows a substantial negative correlation between the proportion of Arabs and percentage of births to unmarried women in the United States with a correlation coefficient (R) of -0.563 and weighted average of 29.2%, a difference of 52.0%.
Births to Unmarried Women Correlation Summary
| Measurement | Yuman | Arab |
| Minimum | 30.5% | 0.20% |
| Maximum | 100.0% | 64.9% |
| Range | 69.5% | 64.7% |
| Mean | 64.7% | 25.1% |
| Median | 64.3% | 26.0% |
| Interquartile 25% (IQ1) | 39.1% | 16.0% |
| Interquartile 75% (IQ3) | 86.7% | 32.9% |
| Interquartile Range (IQR) | 47.6% | 16.9% |
| Standard Deviation (Sample) | 25.6% | 12.3% |
| Standard Deviation (Population) | 24.7% | 12.2% |
Similar Demographics by Births to Unmarried Women
Demographics Similar to Yuman by Births to Unmarried Women
In terms of births to unmarried women, the demographic groups most similar to Yuman are Black/African American (44.3%, a difference of 0.17%), Colville (45.3%, a difference of 2.1%), Kiowa (43.1%, a difference of 2.9%), Puerto Rican (45.7%, a difference of 2.9%), and Native/Alaskan (43.0%, a difference of 3.2%).
| Demographics | Rating | Rank | Births to Unmarried Women |
| Tsimshian | 0.0 /100 | #327 | Tragic 42.2% |
| Immigrants | Cabo Verde | 0.0 /100 | #328 | Tragic 42.2% |
| Paiute | 0.0 /100 | #329 | Tragic 42.5% |
| Chippewa | 0.0 /100 | #330 | Tragic 42.6% |
| Natives/Alaskans | 0.0 /100 | #331 | Tragic 43.0% |
| Kiowa | 0.0 /100 | #332 | Tragic 43.1% |
| Blacks/African Americans | 0.0 /100 | #333 | Tragic 44.3% |
| Yuman | 0.0 /100 | #334 | Tragic 44.4% |
| Colville | 0.0 /100 | #335 | Tragic 45.3% |
| Puerto Ricans | 0.0 /100 | #336 | Tragic 45.7% |
| Houma | 0.0 /100 | #337 | Tragic 46.6% |
| Arapaho | 0.0 /100 | #338 | Tragic 47.1% |
| Lumbee | 0.0 /100 | #339 | Tragic 48.2% |
| Tohono O'odham | 0.0 /100 | #340 | Tragic 49.8% |
| Hopi | 0.0 /100 | #341 | Tragic 50.8% |
Demographics Similar to Arabs by Births to Unmarried Women
In terms of births to unmarried women, the demographic groups most similar to Arabs are Immigrants from Fiji (29.2%, a difference of 0.040%), Estonian (29.2%, a difference of 0.040%), Ukrainian (29.2%, a difference of 0.16%), Immigrants from Latvia (29.1%, a difference of 0.25%), and Immigrants from Vietnam (29.3%, a difference of 0.30%).
| Demographics | Rating | Rank | Births to Unmarried Women |
| Sri Lankans | 97.5 /100 | #85 | Exceptional 28.9% |
| Immigrants | Jordan | 97.4 /100 | #86 | Exceptional 29.0% |
| Taiwanese | 97.3 /100 | #87 | Exceptional 29.0% |
| Immigrants | France | 97.3 /100 | #88 | Exceptional 29.0% |
| Immigrants | Saudi Arabia | 97.0 /100 | #89 | Exceptional 29.1% |
| Immigrants | Latvia | 96.8 /100 | #90 | Exceptional 29.1% |
| Immigrants | Fiji | 96.6 /100 | #91 | Exceptional 29.2% |
| Arabs | 96.5 /100 | #92 | Exceptional 29.2% |
| Estonians | 96.5 /100 | #93 | Exceptional 29.2% |
| Ukrainians | 96.3 /100 | #94 | Exceptional 29.2% |
| Immigrants | Vietnam | 96.1 /100 | #95 | Exceptional 29.3% |
| Norwegians | 95.8 /100 | #96 | Exceptional 29.3% |
| Immigrants | South Africa | 95.7 /100 | #97 | Exceptional 29.3% |
| Immigrants | Syria | 95.7 /100 | #98 | Exceptional 29.4% |
| Immigrants | Denmark | 95.3 /100 | #99 | Exceptional 29.4% |