Immigrants from St. Vincent and the Grenadines vs Thai Births to Unmarried Women
COMPARE
Immigrants from St. Vincent and the Grenadines
Thai
Births to Unmarried Women
Births to Unmarried Women Comparison
Immigrants from St. Vincent and the Grenadines
Thais
37.3%
BIRTHS TO UNMARRIED WOMEN
0.1/ 100
METRIC RATING
280th/ 347
METRIC RANK
24.0%
BIRTHS TO UNMARRIED WOMEN
100.0/ 100
METRIC RATING
7th/ 347
METRIC RANK
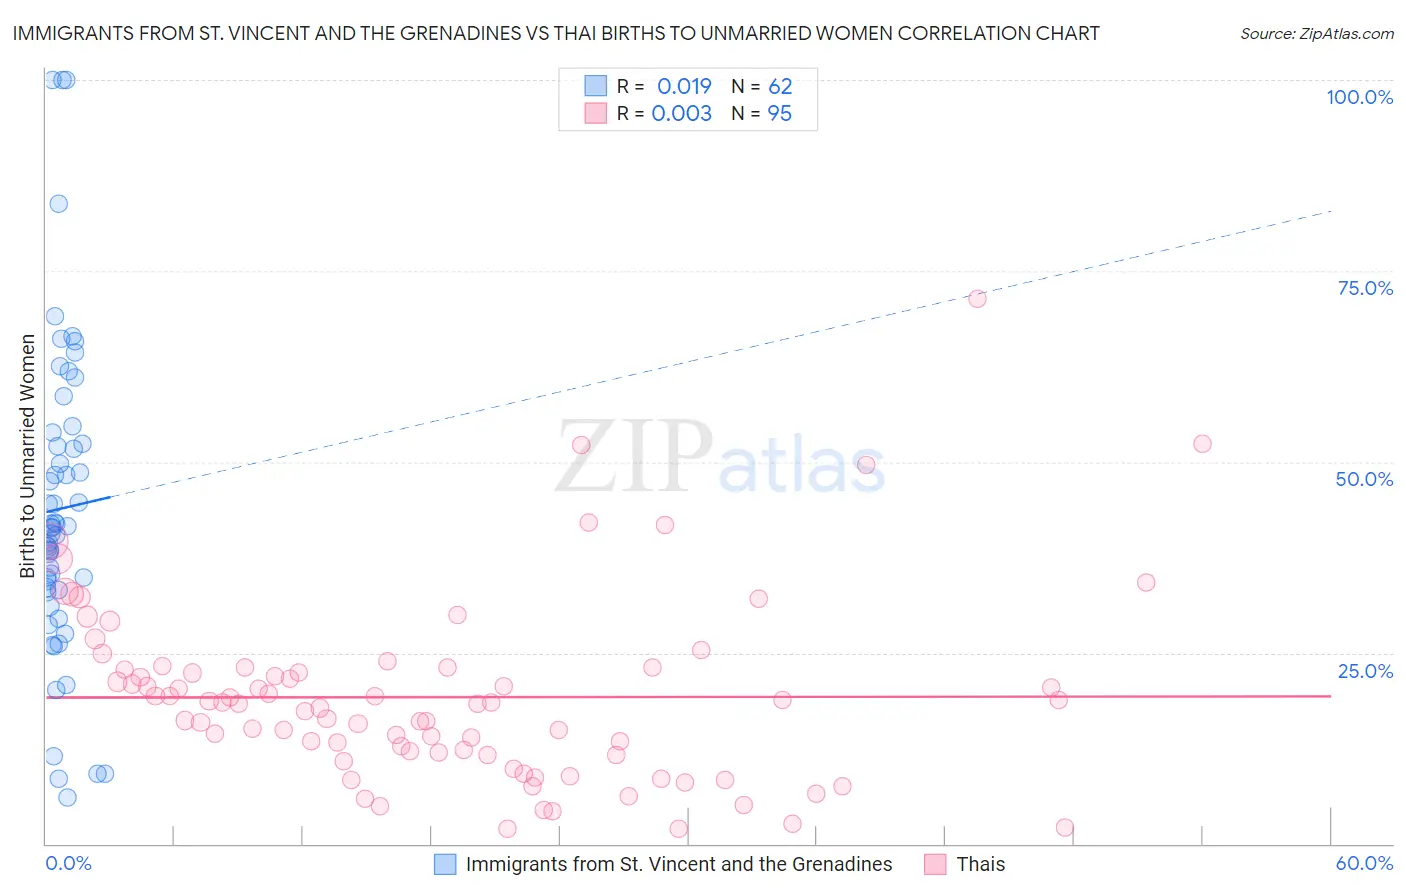
Immigrants from St. Vincent and the Grenadines vs Thai Births to Unmarried Women Correlation Chart
The statistical analysis conducted on geographies consisting of 55,457,752 people shows no correlation between the proportion of Immigrants from St. Vincent and the Grenadines and percentage of births to unmarried women in the United States with a correlation coefficient (R) of 0.019 and weighted average of 37.3%. Similarly, the statistical analysis conducted on geographies consisting of 438,559,293 people shows no correlation between the proportion of Thais and percentage of births to unmarried women in the United States with a correlation coefficient (R) of 0.003 and weighted average of 24.0%, a difference of 55.3%.
Births to Unmarried Women Correlation Summary
| Measurement | Immigrants from St. Vincent and the Grenadines | Thai |
| Minimum | 6.0% | 1.9% |
| Maximum | 100.0% | 71.3% |
| Range | 94.0% | 69.4% |
| Mean | 43.9% | 19.2% |
| Median | 41.5% | 18.4% |
| Interquartile 25% (IQ1) | 33.3% | 11.7% |
| Interquartile 75% (IQ3) | 52.4% | 23.1% |
| Interquartile Range (IQR) | 19.1% | 11.4% |
| Standard Deviation (Sample) | 20.4% | 12.0% |
| Standard Deviation (Population) | 20.2% | 11.9% |
Similar Demographics by Births to Unmarried Women
Demographics Similar to Immigrants from St. Vincent and the Grenadines by Births to Unmarried Women
In terms of births to unmarried women, the demographic groups most similar to Immigrants from St. Vincent and the Grenadines are Immigrants from Belize (37.3%, a difference of 0.020%), West Indian (37.3%, a difference of 0.12%), Liberian (37.4%, a difference of 0.18%), Spanish American Indian (37.4%, a difference of 0.26%), and Immigrants from Central America (37.4%, a difference of 0.33%).
| Demographics | Rating | Rank | Births to Unmarried Women |
| Mexicans | 0.1 /100 | #273 | Tragic 36.9% |
| Cree | 0.1 /100 | #274 | Tragic 37.0% |
| Barbadians | 0.1 /100 | #275 | Tragic 37.0% |
| Belizeans | 0.1 /100 | #276 | Tragic 37.0% |
| Guatemalans | 0.1 /100 | #277 | Tragic 37.1% |
| Immigrants | Latin America | 0.1 /100 | #278 | Tragic 37.1% |
| West Indians | 0.1 /100 | #279 | Tragic 37.3% |
| Immigrants | St. Vincent and the Grenadines | 0.1 /100 | #280 | Tragic 37.3% |
| Immigrants | Belize | 0.1 /100 | #281 | Tragic 37.3% |
| Liberians | 0.0 /100 | #282 | Tragic 37.4% |
| Spanish American Indians | 0.0 /100 | #283 | Tragic 37.4% |
| Immigrants | Central America | 0.0 /100 | #284 | Tragic 37.4% |
| Immigrants | Mexico | 0.0 /100 | #285 | Tragic 37.5% |
| Immigrants | Guatemala | 0.0 /100 | #286 | Tragic 37.5% |
| Creek | 0.0 /100 | #287 | Tragic 37.6% |
Demographics Similar to Thais by Births to Unmarried Women
In terms of births to unmarried women, the demographic groups most similar to Thais are Immigrants from Iran (24.0%, a difference of 0.29%), Immigrants from Hong Kong (23.6%, a difference of 1.9%), Immigrants from China (24.7%, a difference of 2.7%), Immigrants from South Central Asia (24.7%, a difference of 2.7%), and Immigrants from Eastern Asia (25.0%, a difference of 4.2%).
| Demographics | Rating | Rank | Births to Unmarried Women |
| Assyrians/Chaldeans/Syriacs | 100.0 /100 | #1 | Exceptional 22.0% |
| Immigrants | India | 100.0 /100 | #2 | Exceptional 22.9% |
| Filipinos | 100.0 /100 | #3 | Exceptional 23.0% |
| Immigrants | Taiwan | 100.0 /100 | #4 | Exceptional 23.0% |
| Immigrants | Hong Kong | 100.0 /100 | #5 | Exceptional 23.6% |
| Immigrants | Iran | 100.0 /100 | #6 | Exceptional 24.0% |
| Thais | 100.0 /100 | #7 | Exceptional 24.0% |
| Immigrants | China | 100.0 /100 | #8 | Exceptional 24.7% |
| Immigrants | South Central Asia | 100.0 /100 | #9 | Exceptional 24.7% |
| Immigrants | Eastern Asia | 100.0 /100 | #10 | Exceptional 25.0% |
| Immigrants | Israel | 100.0 /100 | #11 | Exceptional 25.1% |
| Indians (Asian) | 100.0 /100 | #12 | Exceptional 25.3% |
| Iranians | 100.0 /100 | #13 | Exceptional 25.3% |
| Immigrants | Lebanon | 100.0 /100 | #14 | Exceptional 25.3% |
| Immigrants | Singapore | 100.0 /100 | #15 | Exceptional 25.6% |