Immigrants from El Salvador vs Belizean Births to Unmarried Women
COMPARE
Immigrants from El Salvador
Belizean
Births to Unmarried Women
Births to Unmarried Women Comparison
Immigrants from El Salvador
Belizeans
36.4%
BIRTHS TO UNMARRIED WOMEN
0.2/ 100
METRIC RATING
259th/ 347
METRIC RANK
37.0%
BIRTHS TO UNMARRIED WOMEN
0.1/ 100
METRIC RATING
276th/ 347
METRIC RANK
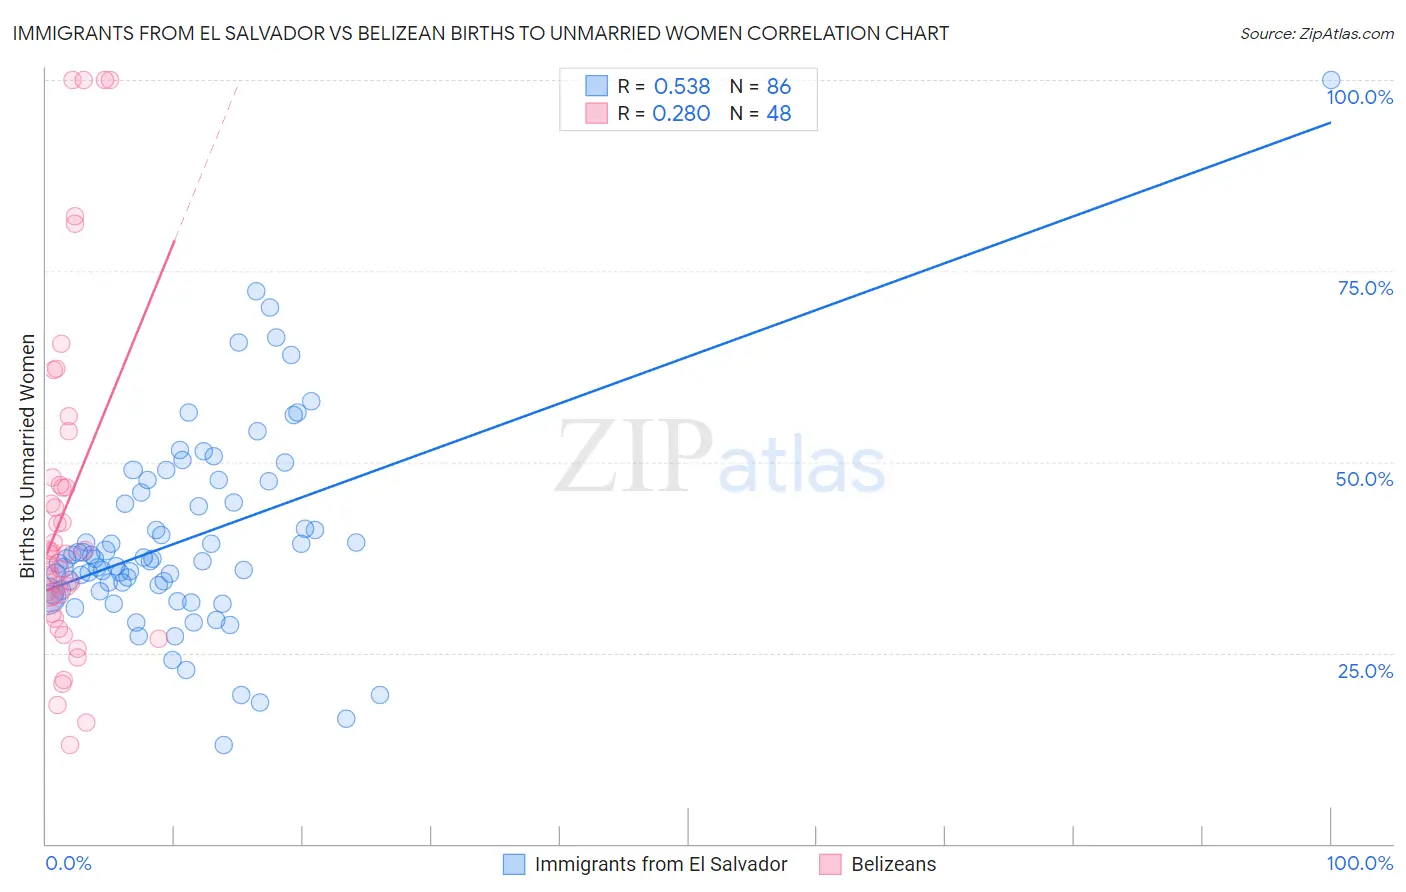
Immigrants from El Salvador vs Belizean Births to Unmarried Women Correlation Chart
The statistical analysis conducted on geographies consisting of 341,352,792 people shows a substantial positive correlation between the proportion of Immigrants from El Salvador and percentage of births to unmarried women in the United States with a correlation coefficient (R) of 0.538 and weighted average of 36.4%. Similarly, the statistical analysis conducted on geographies consisting of 141,847,597 people shows a weak positive correlation between the proportion of Belizeans and percentage of births to unmarried women in the United States with a correlation coefficient (R) of 0.280 and weighted average of 37.0%, a difference of 1.7%.
Births to Unmarried Women Correlation Summary
| Measurement | Immigrants from El Salvador | Belizean |
| Minimum | 12.9% | 13.0% |
| Maximum | 100.0% | 100.0% |
| Range | 87.1% | 87.0% |
| Mean | 39.8% | 44.0% |
| Median | 37.1% | 38.0% |
| Interquartile 25% (IQ1) | 33.0% | 31.1% |
| Interquartile 75% (IQ3) | 45.9% | 47.5% |
| Interquartile Range (IQR) | 12.9% | 16.3% |
| Standard Deviation (Sample) | 13.2% | 22.4% |
| Standard Deviation (Population) | 13.2% | 22.1% |
Demographics Similar to Immigrants from El Salvador and Belizeans by Births to Unmarried Women
In terms of births to unmarried women, the demographic groups most similar to Immigrants from El Salvador are American (36.4%, a difference of 0.050%), Ottawa (36.5%, a difference of 0.12%), Trinidadian and Tobagonian (36.5%, a difference of 0.12%), Immigrants from Grenada (36.3%, a difference of 0.33%), and French American Indian (36.6%, a difference of 0.49%). Similarly, the demographic groups most similar to Belizeans are Barbadian (37.0%, a difference of 0.19%), Cree (37.0%, a difference of 0.22%), Guatemalan (37.1%, a difference of 0.22%), Mexican (36.9%, a difference of 0.31%), and Choctaw (36.9%, a difference of 0.43%).
| Demographics | Rating | Rank | Births to Unmarried Women |
| Immigrants | Grenada | 0.2 /100 | #257 | Tragic 36.3% |
| Americans | 0.2 /100 | #258 | Tragic 36.4% |
| Immigrants | El Salvador | 0.2 /100 | #259 | Tragic 36.4% |
| Ottawa | 0.2 /100 | #260 | Tragic 36.5% |
| Trinidadians and Tobagonians | 0.2 /100 | #261 | Tragic 36.5% |
| French American Indians | 0.1 /100 | #262 | Tragic 36.6% |
| Nicaraguans | 0.1 /100 | #263 | Tragic 36.6% |
| Sub-Saharan Africans | 0.1 /100 | #264 | Tragic 36.7% |
| Cherokee | 0.1 /100 | #265 | Tragic 36.7% |
| Immigrants | Senegal | 0.1 /100 | #266 | Tragic 36.7% |
| Central Americans | 0.1 /100 | #267 | Tragic 36.7% |
| Comanche | 0.1 /100 | #268 | Tragic 36.7% |
| Senegalese | 0.1 /100 | #269 | Tragic 36.8% |
| Immigrants | Congo | 0.1 /100 | #270 | Tragic 36.8% |
| Immigrants | Barbados | 0.1 /100 | #271 | Tragic 36.8% |
| Choctaw | 0.1 /100 | #272 | Tragic 36.9% |
| Mexicans | 0.1 /100 | #273 | Tragic 36.9% |
| Cree | 0.1 /100 | #274 | Tragic 37.0% |
| Barbadians | 0.1 /100 | #275 | Tragic 37.0% |
| Belizeans | 0.1 /100 | #276 | Tragic 37.0% |
| Guatemalans | 0.1 /100 | #277 | Tragic 37.1% |