White/Caucasian vs Belizean No Schooling Completed
COMPARE
White/Caucasian
Belizean
No Schooling Completed
No Schooling Completed Comparison
Whites/Caucasians
Belizeans
1.6%
NO SCHOOLING COMPLETED
99.9/ 100
METRIC RATING
49th/ 347
METRIC RANK
3.0%
NO SCHOOLING COMPLETED
0.0/ 100
METRIC RATING
306th/ 347
METRIC RANK
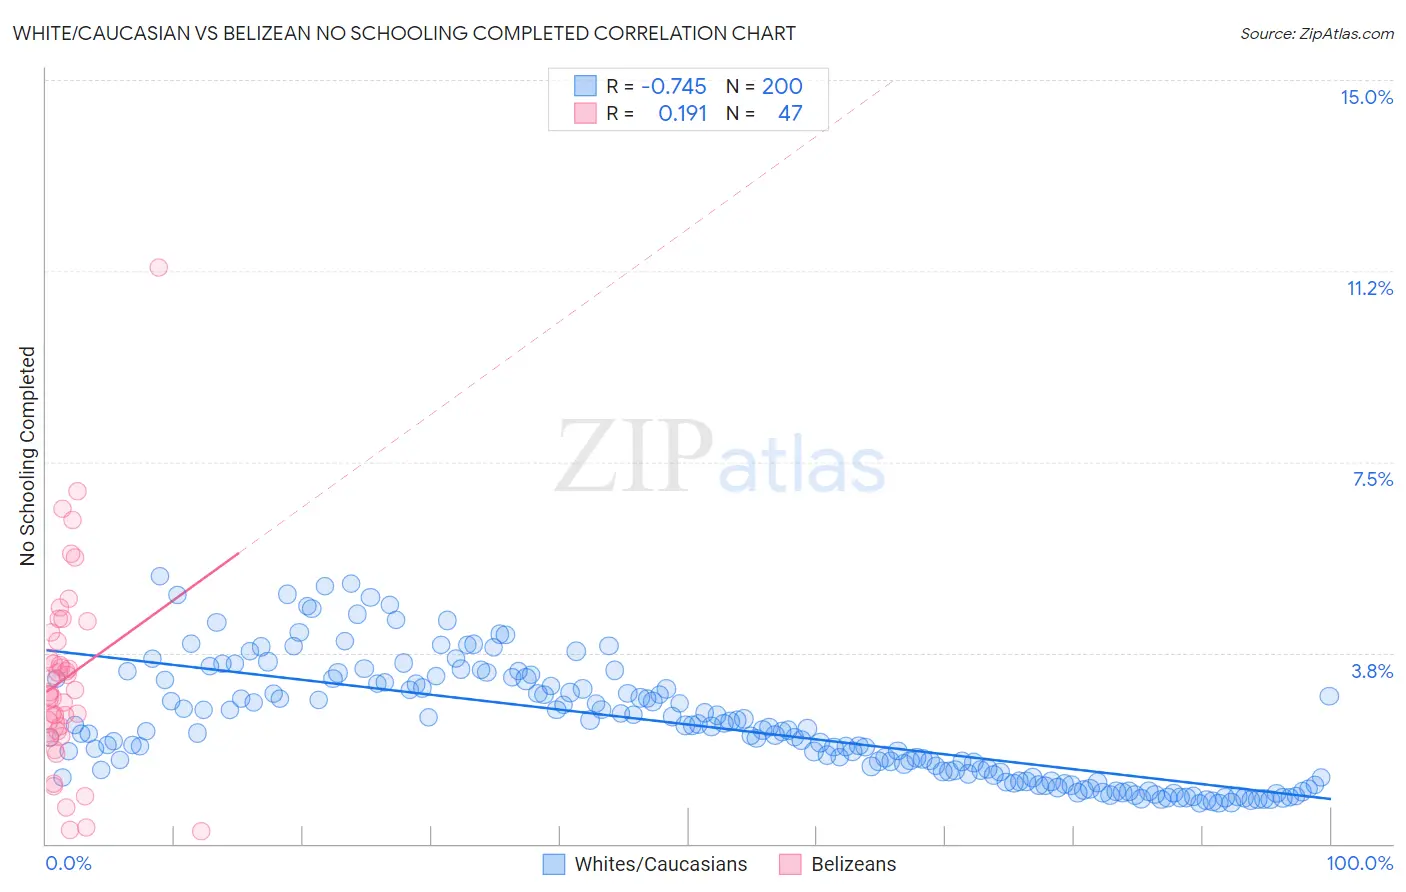
White/Caucasian vs Belizean No Schooling Completed Correlation Chart
The statistical analysis conducted on geographies consisting of 562,623,303 people shows a strong negative correlation between the proportion of Whites/Caucasians and percentage of population with no schooling in the United States with a correlation coefficient (R) of -0.745 and weighted average of 1.6%. Similarly, the statistical analysis conducted on geographies consisting of 143,887,803 people shows a poor positive correlation between the proportion of Belizeans and percentage of population with no schooling in the United States with a correlation coefficient (R) of 0.191 and weighted average of 3.0%, a difference of 84.3%.
No Schooling Completed Correlation Summary
| Measurement | White/Caucasian | Belizean |
| Minimum | 0.80% | 0.25% |
| Maximum | 5.2% | 11.3% |
| Range | 4.5% | 11.1% |
| Mean | 2.3% | 3.3% |
| Median | 2.2% | 3.0% |
| Interquartile 25% (IQ1) | 1.3% | 2.2% |
| Interquartile 75% (IQ3) | 3.2% | 4.2% |
| Interquartile Range (IQR) | 1.9% | 1.9% |
| Standard Deviation (Sample) | 1.1% | 2.0% |
| Standard Deviation (Population) | 1.1% | 2.0% |
Similar Demographics by No Schooling Completed
Demographics Similar to Whites/Caucasians by No Schooling Completed
In terms of no schooling completed, the demographic groups most similar to Whites/Caucasians are Immigrants from Scotland (1.6%, a difference of 0.060%), Celtic (1.6%, a difference of 0.13%), Ottawa (1.6%, a difference of 0.31%), Chippewa (1.6%, a difference of 0.34%), and Immigrants from Canada (1.6%, a difference of 0.41%).
| Demographics | Rating | Rank | No Schooling Completed |
| Bulgarians | 99.9 /100 | #42 | Exceptional 1.6% |
| Australians | 99.9 /100 | #43 | Exceptional 1.6% |
| Estonians | 99.9 /100 | #44 | Exceptional 1.6% |
| Czechoslovakians | 99.9 /100 | #45 | Exceptional 1.6% |
| Maltese | 99.9 /100 | #46 | Exceptional 1.6% |
| Ottawa | 99.9 /100 | #47 | Exceptional 1.6% |
| Immigrants | Scotland | 99.9 /100 | #48 | Exceptional 1.6% |
| Whites/Caucasians | 99.9 /100 | #49 | Exceptional 1.6% |
| Celtics | 99.9 /100 | #50 | Exceptional 1.6% |
| Chippewa | 99.8 /100 | #51 | Exceptional 1.6% |
| Immigrants | Canada | 99.8 /100 | #52 | Exceptional 1.6% |
| Creek | 99.8 /100 | #53 | Exceptional 1.6% |
| Crow | 99.8 /100 | #54 | Exceptional 1.6% |
| Greeks | 99.8 /100 | #55 | Exceptional 1.6% |
| Immigrants | North America | 99.8 /100 | #56 | Exceptional 1.6% |
Demographics Similar to Belizeans by No Schooling Completed
In terms of no schooling completed, the demographic groups most similar to Belizeans are Immigrants from Haiti (3.0%, a difference of 0.080%), Immigrants from Somalia (3.0%, a difference of 0.24%), Hispanic or Latino (3.0%, a difference of 1.1%), Guyanese (3.0%, a difference of 1.1%), and Immigrants from the Azores (3.0%, a difference of 1.2%).
| Demographics | Rating | Rank | No Schooling Completed |
| Central American Indians | 0.0 /100 | #299 | Tragic 2.8% |
| Haitians | 0.0 /100 | #300 | Tragic 2.9% |
| Immigrants | South Eastern Asia | 0.0 /100 | #301 | Tragic 2.9% |
| Immigrants | Caribbean | 0.0 /100 | #302 | Tragic 2.9% |
| Somalis | 0.0 /100 | #303 | Tragic 2.9% |
| Nicaraguans | 0.0 /100 | #304 | Tragic 2.9% |
| Ecuadorians | 0.0 /100 | #305 | Tragic 3.0% |
| Belizeans | 0.0 /100 | #306 | Tragic 3.0% |
| Immigrants | Haiti | 0.0 /100 | #307 | Tragic 3.0% |
| Immigrants | Somalia | 0.0 /100 | #308 | Tragic 3.0% |
| Hispanics or Latinos | 0.0 /100 | #309 | Tragic 3.0% |
| Guyanese | 0.0 /100 | #310 | Tragic 3.0% |
| Immigrants | Azores | 0.0 /100 | #311 | Tragic 3.0% |
| Sri Lankans | 0.0 /100 | #312 | Tragic 3.0% |
| Hondurans | 0.0 /100 | #313 | Tragic 3.1% |