Kenyan vs Belizean Births to Unmarried Women
COMPARE
Kenyan
Belizean
Births to Unmarried Women
Births to Unmarried Women Comparison
Kenyans
Belizeans
31.9%
BIRTHS TO UNMARRIED WOMEN
43.0/ 100
METRIC RATING
182nd/ 347
METRIC RANK
37.0%
BIRTHS TO UNMARRIED WOMEN
0.1/ 100
METRIC RATING
276th/ 347
METRIC RANK
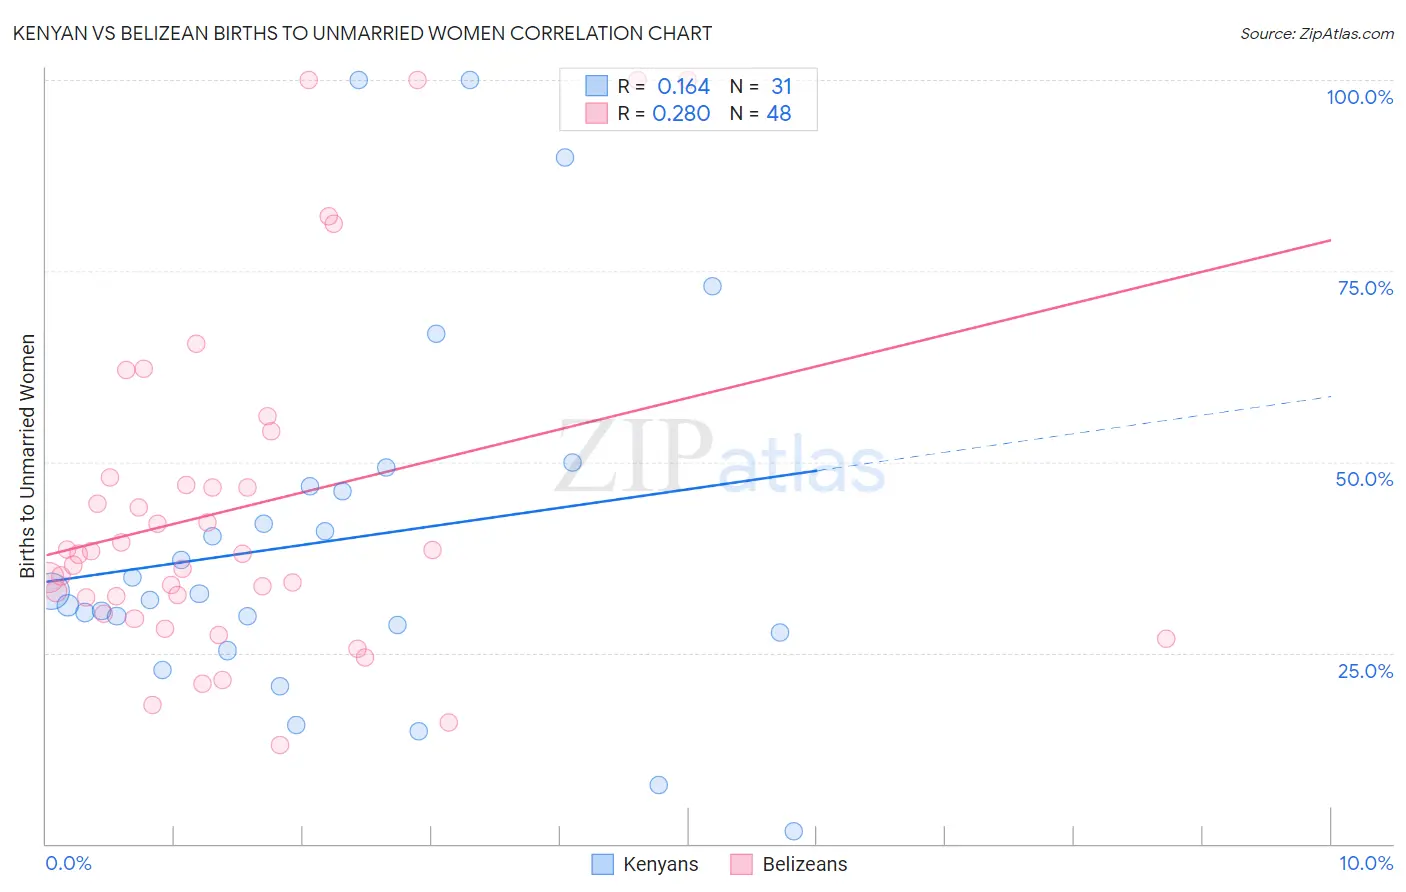
Kenyan vs Belizean Births to Unmarried Women Correlation Chart
The statistical analysis conducted on geographies consisting of 163,852,803 people shows a poor positive correlation between the proportion of Kenyans and percentage of births to unmarried women in the United States with a correlation coefficient (R) of 0.164 and weighted average of 31.9%. Similarly, the statistical analysis conducted on geographies consisting of 141,847,597 people shows a weak positive correlation between the proportion of Belizeans and percentage of births to unmarried women in the United States with a correlation coefficient (R) of 0.280 and weighted average of 37.0%, a difference of 16.2%.
Births to Unmarried Women Correlation Summary
| Measurement | Kenyan | Belizean |
| Minimum | 1.6% | 13.0% |
| Maximum | 100.0% | 100.0% |
| Range | 98.4% | 87.0% |
| Mean | 39.7% | 44.0% |
| Median | 32.7% | 38.0% |
| Interquartile 25% (IQ1) | 27.6% | 31.1% |
| Interquartile 75% (IQ3) | 46.9% | 47.5% |
| Interquartile Range (IQR) | 19.3% | 16.3% |
| Standard Deviation (Sample) | 24.0% | 22.4% |
| Standard Deviation (Population) | 23.7% | 22.1% |
Similar Demographics by Births to Unmarried Women
Demographics Similar to Kenyans by Births to Unmarried Women
In terms of births to unmarried women, the demographic groups most similar to Kenyans are Canadian (31.9%, a difference of 0.16%), Immigrants from Peru (31.8%, a difference of 0.20%), Immigrants from South America (32.0%, a difference of 0.23%), Moroccan (31.8%, a difference of 0.26%), and German (32.0%, a difference of 0.34%).
| Demographics | Rating | Rank | Births to Unmarried Women |
| Immigrants | Venezuela | 49.2 /100 | #175 | Average 31.7% |
| Scottish | 48.1 /100 | #176 | Average 31.7% |
| South American Indians | 47.7 /100 | #177 | Average 31.7% |
| English | 47.4 /100 | #178 | Average 31.7% |
| South Americans | 46.9 /100 | #179 | Average 31.8% |
| Moroccans | 45.7 /100 | #180 | Average 31.8% |
| Immigrants | Peru | 45.1 /100 | #181 | Average 31.8% |
| Kenyans | 43.0 /100 | #182 | Average 31.9% |
| Canadians | 41.4 /100 | #183 | Average 31.9% |
| Immigrants | South America | 40.7 /100 | #184 | Average 32.0% |
| Germans | 39.5 /100 | #185 | Fair 32.0% |
| Welsh | 38.2 /100 | #186 | Fair 32.0% |
| Czechoslovakians | 38.0 /100 | #187 | Fair 32.0% |
| Osage | 37.1 /100 | #188 | Fair 32.1% |
| Immigrants | Kenya | 36.9 /100 | #189 | Fair 32.1% |
Demographics Similar to Belizeans by Births to Unmarried Women
In terms of births to unmarried women, the demographic groups most similar to Belizeans are Barbadian (37.0%, a difference of 0.19%), Cree (37.0%, a difference of 0.22%), Guatemalan (37.1%, a difference of 0.22%), Immigrants from Latin America (37.1%, a difference of 0.30%), and Mexican (36.9%, a difference of 0.31%).
| Demographics | Rating | Rank | Births to Unmarried Women |
| Senegalese | 0.1 /100 | #269 | Tragic 36.8% |
| Immigrants | Congo | 0.1 /100 | #270 | Tragic 36.8% |
| Immigrants | Barbados | 0.1 /100 | #271 | Tragic 36.8% |
| Choctaw | 0.1 /100 | #272 | Tragic 36.9% |
| Mexicans | 0.1 /100 | #273 | Tragic 36.9% |
| Cree | 0.1 /100 | #274 | Tragic 37.0% |
| Barbadians | 0.1 /100 | #275 | Tragic 37.0% |
| Belizeans | 0.1 /100 | #276 | Tragic 37.0% |
| Guatemalans | 0.1 /100 | #277 | Tragic 37.1% |
| Immigrants | Latin America | 0.1 /100 | #278 | Tragic 37.1% |
| West Indians | 0.1 /100 | #279 | Tragic 37.3% |
| Immigrants | St. Vincent and the Grenadines | 0.1 /100 | #280 | Tragic 37.3% |
| Immigrants | Belize | 0.1 /100 | #281 | Tragic 37.3% |
| Liberians | 0.0 /100 | #282 | Tragic 37.4% |
| Spanish American Indians | 0.0 /100 | #283 | Tragic 37.4% |