Irish vs Belizean Births to Unmarried Women
COMPARE
Irish
Belizean
Births to Unmarried Women
Births to Unmarried Women Comparison
Irish
Belizeans
32.2%
BIRTHS TO UNMARRIED WOMEN
32.4/ 100
METRIC RATING
191st/ 347
METRIC RANK
37.0%
BIRTHS TO UNMARRIED WOMEN
0.1/ 100
METRIC RATING
276th/ 347
METRIC RANK
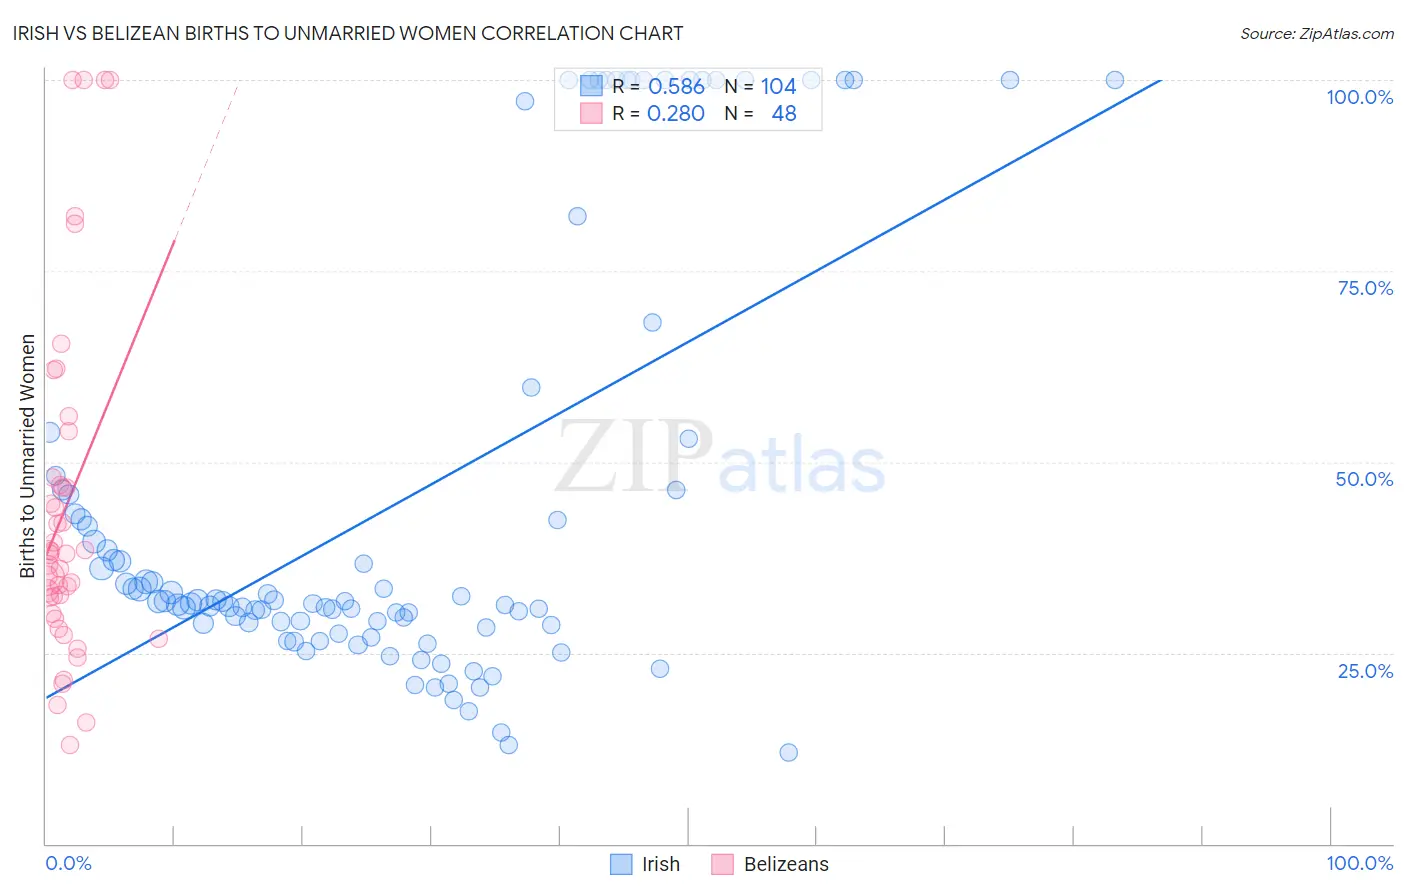
Irish vs Belizean Births to Unmarried Women Correlation Chart
The statistical analysis conducted on geographies consisting of 510,434,207 people shows a substantial positive correlation between the proportion of Irish and percentage of births to unmarried women in the United States with a correlation coefficient (R) of 0.586 and weighted average of 32.2%. Similarly, the statistical analysis conducted on geographies consisting of 141,847,597 people shows a weak positive correlation between the proportion of Belizeans and percentage of births to unmarried women in the United States with a correlation coefficient (R) of 0.280 and weighted average of 37.0%, a difference of 14.9%.
Births to Unmarried Women Correlation Summary
| Measurement | Irish | Belizean |
| Minimum | 11.9% | 13.0% |
| Maximum | 100.0% | 100.0% |
| Range | 88.1% | 87.0% |
| Mean | 44.6% | 44.0% |
| Median | 31.8% | 38.0% |
| Interquartile 25% (IQ1) | 28.8% | 31.1% |
| Interquartile 75% (IQ3) | 46.3% | 47.5% |
| Interquartile Range (IQR) | 17.6% | 16.3% |
| Standard Deviation (Sample) | 28.0% | 22.4% |
| Standard Deviation (Population) | 27.9% | 22.1% |
Similar Demographics by Births to Unmarried Women
Demographics Similar to Irish by Births to Unmarried Women
In terms of births to unmarried women, the demographic groups most similar to Irish are Tlingit-Haida (32.2%, a difference of 0.020%), Colombian (32.2%, a difference of 0.050%), Fijian (32.3%, a difference of 0.14%), Immigrants from Kenya (32.1%, a difference of 0.46%), and Osage (32.1%, a difference of 0.49%).
| Demographics | Rating | Rank | Births to Unmarried Women |
| Immigrants | South America | 40.7 /100 | #184 | Average 32.0% |
| Germans | 39.5 /100 | #185 | Fair 32.0% |
| Welsh | 38.2 /100 | #186 | Fair 32.0% |
| Czechoslovakians | 38.0 /100 | #187 | Fair 32.0% |
| Osage | 37.1 /100 | #188 | Fair 32.1% |
| Immigrants | Kenya | 36.9 /100 | #189 | Fair 32.1% |
| Tlingit-Haida | 32.6 /100 | #190 | Fair 32.2% |
| Irish | 32.4 /100 | #191 | Fair 32.2% |
| Colombians | 31.9 /100 | #192 | Fair 32.2% |
| Fijians | 31.1 /100 | #193 | Fair 32.3% |
| Sudanese | 27.3 /100 | #194 | Fair 32.4% |
| Samoans | 21.9 /100 | #195 | Fair 32.6% |
| Immigrants | Colombia | 21.7 /100 | #196 | Fair 32.6% |
| Immigrants | Immigrants | 20.6 /100 | #197 | Fair 32.7% |
| Costa Ricans | 20.3 /100 | #198 | Fair 32.7% |
Demographics Similar to Belizeans by Births to Unmarried Women
In terms of births to unmarried women, the demographic groups most similar to Belizeans are Barbadian (37.0%, a difference of 0.19%), Cree (37.0%, a difference of 0.22%), Guatemalan (37.1%, a difference of 0.22%), Immigrants from Latin America (37.1%, a difference of 0.30%), and Mexican (36.9%, a difference of 0.31%).
| Demographics | Rating | Rank | Births to Unmarried Women |
| Senegalese | 0.1 /100 | #269 | Tragic 36.8% |
| Immigrants | Congo | 0.1 /100 | #270 | Tragic 36.8% |
| Immigrants | Barbados | 0.1 /100 | #271 | Tragic 36.8% |
| Choctaw | 0.1 /100 | #272 | Tragic 36.9% |
| Mexicans | 0.1 /100 | #273 | Tragic 36.9% |
| Cree | 0.1 /100 | #274 | Tragic 37.0% |
| Barbadians | 0.1 /100 | #275 | Tragic 37.0% |
| Belizeans | 0.1 /100 | #276 | Tragic 37.0% |
| Guatemalans | 0.1 /100 | #277 | Tragic 37.1% |
| Immigrants | Latin America | 0.1 /100 | #278 | Tragic 37.1% |
| West Indians | 0.1 /100 | #279 | Tragic 37.3% |
| Immigrants | St. Vincent and the Grenadines | 0.1 /100 | #280 | Tragic 37.3% |
| Immigrants | Belize | 0.1 /100 | #281 | Tragic 37.3% |
| Liberians | 0.0 /100 | #282 | Tragic 37.4% |
| Spanish American Indians | 0.0 /100 | #283 | Tragic 37.4% |