Ute vs Sioux Births to Unmarried Women
COMPARE
Ute
Sioux
Births to Unmarried Women
Births to Unmarried Women Comparison
Ute
Sioux
33.0%
BIRTHS TO UNMARRIED WOMEN
14.4/ 100
METRIC RATING
203rd/ 347
METRIC RANK
41.0%
BIRTHS TO UNMARRIED WOMEN
0.0/ 100
METRIC RATING
323rd/ 347
METRIC RANK
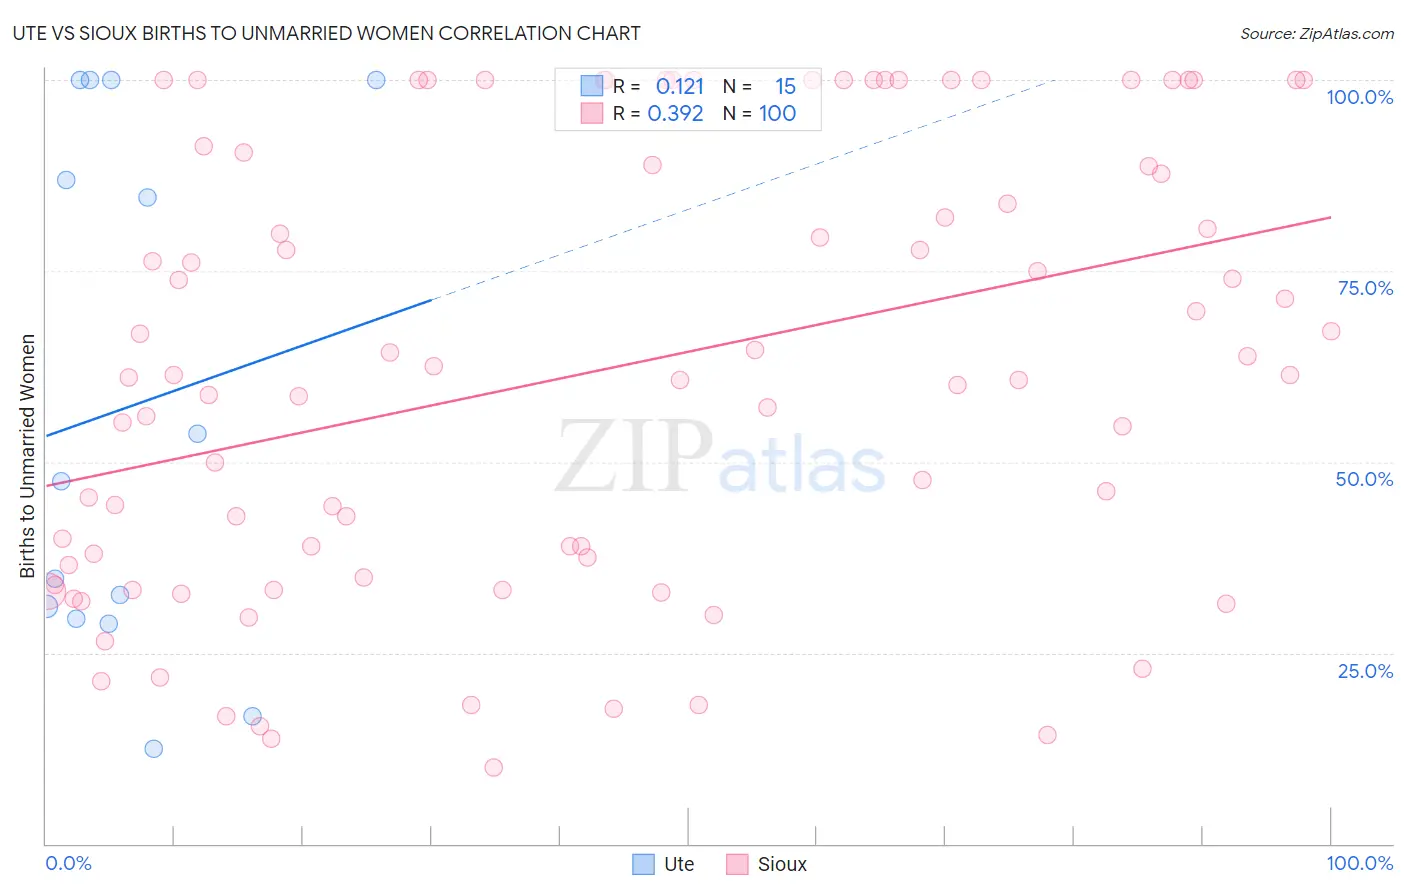
Ute vs Sioux Births to Unmarried Women Correlation Chart
The statistical analysis conducted on geographies consisting of 54,718,542 people shows a poor positive correlation between the proportion of Ute and percentage of births to unmarried women in the United States with a correlation coefficient (R) of 0.121 and weighted average of 33.0%. Similarly, the statistical analysis conducted on geographies consisting of 224,573,646 people shows a mild positive correlation between the proportion of Sioux and percentage of births to unmarried women in the United States with a correlation coefficient (R) of 0.392 and weighted average of 41.0%, a difference of 24.2%.
Births to Unmarried Women Correlation Summary
| Measurement | Ute | Sioux |
| Minimum | 12.5% | 10.0% |
| Maximum | 100.0% | 100.0% |
| Range | 87.5% | 90.0% |
| Mean | 57.2% | 61.9% |
| Median | 47.5% | 61.2% |
| Interquartile 25% (IQ1) | 29.4% | 35.7% |
| Interquartile 75% (IQ3) | 100.0% | 89.7% |
| Interquartile Range (IQR) | 70.6% | 54.0% |
| Standard Deviation (Sample) | 33.9% | 28.7% |
| Standard Deviation (Population) | 32.7% | 28.5% |
Similar Demographics by Births to Unmarried Women
Demographics Similar to Ute by Births to Unmarried Women
In terms of births to unmarried women, the demographic groups most similar to Ute are Immigrants from Africa (33.0%, a difference of 0.020%), German Russian (33.1%, a difference of 0.25%), Uruguayan (33.1%, a difference of 0.31%), Immigrants from Micronesia (32.9%, a difference of 0.38%), and Immigrants from Burma/Myanmar (32.9%, a difference of 0.39%).
| Demographics | Rating | Rank | Births to Unmarried Women |
| Immigrants | Colombia | 21.7 /100 | #196 | Fair 32.6% |
| Immigrants | Immigrants | 20.6 /100 | #197 | Fair 32.7% |
| Costa Ricans | 20.3 /100 | #198 | Fair 32.7% |
| Immigrants | Thailand | 18.9 /100 | #199 | Poor 32.8% |
| Immigrants | Germany | 18.8 /100 | #200 | Poor 32.8% |
| Immigrants | Burma/Myanmar | 16.7 /100 | #201 | Poor 32.9% |
| Immigrants | Micronesia | 16.6 /100 | #202 | Poor 32.9% |
| Ute | 14.4 /100 | #203 | Poor 33.0% |
| Immigrants | Africa | 14.3 /100 | #204 | Poor 33.0% |
| German Russians | 13.1 /100 | #205 | Poor 33.1% |
| Uruguayans | 12.8 /100 | #206 | Poor 33.1% |
| Immigrants | Sudan | 11.5 /100 | #207 | Poor 33.2% |
| Hawaiians | 11.3 /100 | #208 | Poor 33.2% |
| Whites/Caucasians | 10.7 /100 | #209 | Poor 33.3% |
| Scotch-Irish | 10.7 /100 | #210 | Poor 33.3% |
Demographics Similar to Sioux by Births to Unmarried Women
In terms of births to unmarried women, the demographic groups most similar to Sioux are Cajun (41.0%, a difference of 0.070%), Bahamian (40.8%, a difference of 0.56%), Cape Verdean (41.3%, a difference of 0.80%), Cheyenne (41.3%, a difference of 0.85%), and Immigrants from Cuba (41.5%, a difference of 1.1%).
| Demographics | Rating | Rank | Births to Unmarried Women |
| Apache | 0.0 /100 | #316 | Tragic 39.9% |
| Immigrants | Dominican Republic | 0.0 /100 | #317 | Tragic 40.1% |
| Immigrants | Bahamas | 0.0 /100 | #318 | Tragic 40.1% |
| Yakama | 0.0 /100 | #319 | Tragic 40.3% |
| Crow | 0.0 /100 | #320 | Tragic 40.4% |
| Bahamians | 0.0 /100 | #321 | Tragic 40.8% |
| Cajuns | 0.0 /100 | #322 | Tragic 41.0% |
| Sioux | 0.0 /100 | #323 | Tragic 41.0% |
| Cape Verdeans | 0.0 /100 | #324 | Tragic 41.3% |
| Cheyenne | 0.0 /100 | #325 | Tragic 41.3% |
| Immigrants | Cuba | 0.0 /100 | #326 | Tragic 41.5% |
| Tsimshian | 0.0 /100 | #327 | Tragic 42.2% |
| Immigrants | Cabo Verde | 0.0 /100 | #328 | Tragic 42.2% |
| Paiute | 0.0 /100 | #329 | Tragic 42.5% |
| Chippewa | 0.0 /100 | #330 | Tragic 42.6% |