Immigrants from El Salvador vs Sioux Births to Unmarried Women
COMPARE
Immigrants from El Salvador
Sioux
Births to Unmarried Women
Births to Unmarried Women Comparison
Immigrants from El Salvador
Sioux
36.4%
BIRTHS TO UNMARRIED WOMEN
0.2/ 100
METRIC RATING
259th/ 347
METRIC RANK
41.0%
BIRTHS TO UNMARRIED WOMEN
0.0/ 100
METRIC RATING
323rd/ 347
METRIC RANK
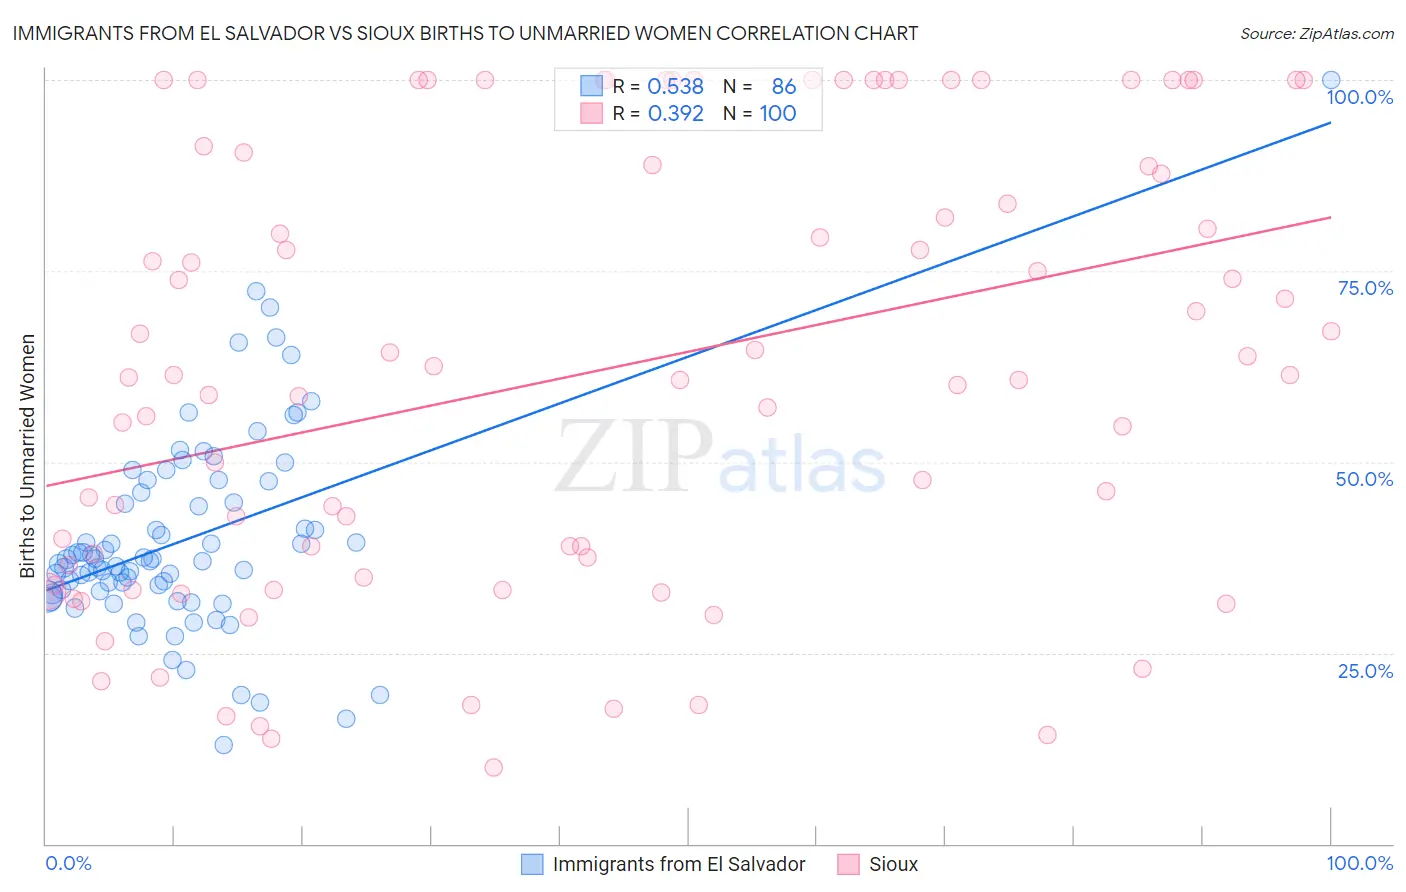
Immigrants from El Salvador vs Sioux Births to Unmarried Women Correlation Chart
The statistical analysis conducted on geographies consisting of 341,352,792 people shows a substantial positive correlation between the proportion of Immigrants from El Salvador and percentage of births to unmarried women in the United States with a correlation coefficient (R) of 0.538 and weighted average of 36.4%. Similarly, the statistical analysis conducted on geographies consisting of 224,573,646 people shows a mild positive correlation between the proportion of Sioux and percentage of births to unmarried women in the United States with a correlation coefficient (R) of 0.392 and weighted average of 41.0%, a difference of 12.6%.
Births to Unmarried Women Correlation Summary
| Measurement | Immigrants from El Salvador | Sioux |
| Minimum | 12.9% | 10.0% |
| Maximum | 100.0% | 100.0% |
| Range | 87.1% | 90.0% |
| Mean | 39.8% | 61.9% |
| Median | 37.1% | 61.2% |
| Interquartile 25% (IQ1) | 33.0% | 35.7% |
| Interquartile 75% (IQ3) | 45.9% | 89.7% |
| Interquartile Range (IQR) | 12.9% | 54.0% |
| Standard Deviation (Sample) | 13.2% | 28.7% |
| Standard Deviation (Population) | 13.2% | 28.5% |
Similar Demographics by Births to Unmarried Women
Demographics Similar to Immigrants from El Salvador by Births to Unmarried Women
In terms of births to unmarried women, the demographic groups most similar to Immigrants from El Salvador are American (36.4%, a difference of 0.050%), Ottawa (36.5%, a difference of 0.12%), Trinidadian and Tobagonian (36.5%, a difference of 0.12%), Immigrants from Grenada (36.3%, a difference of 0.33%), and Chickasaw (36.3%, a difference of 0.36%).
| Demographics | Rating | Rank | Births to Unmarried Women |
| Salvadorans | 0.3 /100 | #252 | Tragic 36.0% |
| Immigrants | Portugal | 0.2 /100 | #253 | Tragic 36.2% |
| Potawatomi | 0.2 /100 | #254 | Tragic 36.2% |
| Chickasaw | 0.2 /100 | #255 | Tragic 36.3% |
| Immigrants | Trinidad and Tobago | 0.2 /100 | #256 | Tragic 36.3% |
| Immigrants | Grenada | 0.2 /100 | #257 | Tragic 36.3% |
| Americans | 0.2 /100 | #258 | Tragic 36.4% |
| Immigrants | El Salvador | 0.2 /100 | #259 | Tragic 36.4% |
| Ottawa | 0.2 /100 | #260 | Tragic 36.5% |
| Trinidadians and Tobagonians | 0.2 /100 | #261 | Tragic 36.5% |
| French American Indians | 0.1 /100 | #262 | Tragic 36.6% |
| Nicaraguans | 0.1 /100 | #263 | Tragic 36.6% |
| Sub-Saharan Africans | 0.1 /100 | #264 | Tragic 36.7% |
| Cherokee | 0.1 /100 | #265 | Tragic 36.7% |
| Immigrants | Senegal | 0.1 /100 | #266 | Tragic 36.7% |
Demographics Similar to Sioux by Births to Unmarried Women
In terms of births to unmarried women, the demographic groups most similar to Sioux are Cajun (41.0%, a difference of 0.070%), Bahamian (40.8%, a difference of 0.56%), Cape Verdean (41.3%, a difference of 0.80%), Cheyenne (41.3%, a difference of 0.85%), and Immigrants from Cuba (41.5%, a difference of 1.1%).
| Demographics | Rating | Rank | Births to Unmarried Women |
| Apache | 0.0 /100 | #316 | Tragic 39.9% |
| Immigrants | Dominican Republic | 0.0 /100 | #317 | Tragic 40.1% |
| Immigrants | Bahamas | 0.0 /100 | #318 | Tragic 40.1% |
| Yakama | 0.0 /100 | #319 | Tragic 40.3% |
| Crow | 0.0 /100 | #320 | Tragic 40.4% |
| Bahamians | 0.0 /100 | #321 | Tragic 40.8% |
| Cajuns | 0.0 /100 | #322 | Tragic 41.0% |
| Sioux | 0.0 /100 | #323 | Tragic 41.0% |
| Cape Verdeans | 0.0 /100 | #324 | Tragic 41.3% |
| Cheyenne | 0.0 /100 | #325 | Tragic 41.3% |
| Immigrants | Cuba | 0.0 /100 | #326 | Tragic 41.5% |
| Tsimshian | 0.0 /100 | #327 | Tragic 42.2% |
| Immigrants | Cabo Verde | 0.0 /100 | #328 | Tragic 42.2% |
| Paiute | 0.0 /100 | #329 | Tragic 42.5% |
| Chippewa | 0.0 /100 | #330 | Tragic 42.6% |