Ute vs Sioux Vision Disability
COMPARE
Ute
Sioux
Vision Disability
Vision Disability Comparison
Ute
Sioux
2.4%
VISION DISABILITY
0.1/ 100
METRIC RATING
267th/ 347
METRIC RANK
2.5%
VISION DISABILITY
0.0/ 100
METRIC RATING
286th/ 347
METRIC RANK
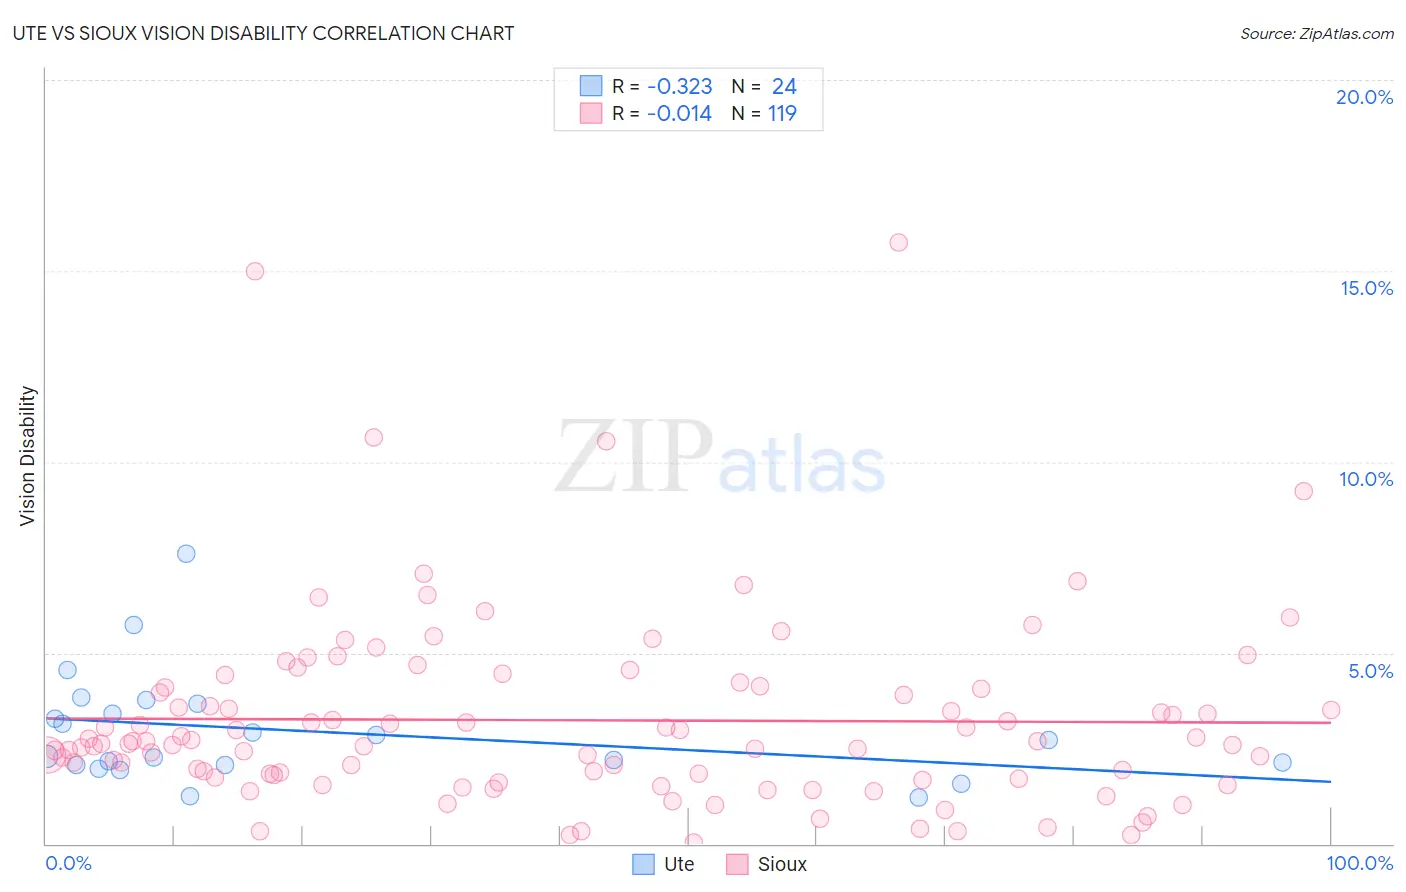
Ute vs Sioux Vision Disability Correlation Chart
The statistical analysis conducted on geographies consisting of 55,653,653 people shows a mild negative correlation between the proportion of Ute and percentage of population with vision disability in the United States with a correlation coefficient (R) of -0.323 and weighted average of 2.4%. Similarly, the statistical analysis conducted on geographies consisting of 234,049,152 people shows no correlation between the proportion of Sioux and percentage of population with vision disability in the United States with a correlation coefficient (R) of -0.014 and weighted average of 2.5%, a difference of 2.8%.
Vision Disability Correlation Summary
| Measurement | Ute | Sioux |
| Minimum | 1.2% | 0.034% |
| Maximum | 7.6% | 15.7% |
| Range | 6.4% | 15.7% |
| Mean | 2.9% | 3.2% |
| Median | 2.5% | 2.6% |
| Interquartile 25% (IQ1) | 2.1% | 1.7% |
| Interquartile 75% (IQ3) | 3.5% | 4.1% |
| Interquartile Range (IQR) | 1.5% | 2.3% |
| Standard Deviation (Sample) | 1.5% | 2.5% |
| Standard Deviation (Population) | 1.4% | 2.5% |
Demographics Similar to Ute and Sioux by Vision Disability
In terms of vision disability, the demographic groups most similar to Ute are Mexican American Indian (2.4%, a difference of 0.010%), Senegalese (2.4%, a difference of 0.090%), Celtic (2.4%, a difference of 0.36%), Cuban (2.4%, a difference of 0.37%), and Immigrants from the Azores (2.4%, a difference of 0.52%). Similarly, the demographic groups most similar to Sioux are Immigrants from Central America (2.5%, a difference of 0.010%), Yakama (2.5%, a difference of 0.030%), Puget Sound Salish (2.5%, a difference of 0.31%), Immigrants from Caribbean (2.5%, a difference of 0.44%), and U.S. Virgin Islander (2.5%, a difference of 0.56%).
| Demographics | Rating | Rank | Vision Disability |
| Mexican American Indians | 0.1 /100 | #266 | Tragic 2.4% |
| Ute | 0.1 /100 | #267 | Tragic 2.4% |
| Senegalese | 0.1 /100 | #268 | Tragic 2.4% |
| Celtics | 0.1 /100 | #269 | Tragic 2.4% |
| Cubans | 0.1 /100 | #270 | Tragic 2.4% |
| Immigrants | Azores | 0.1 /100 | #271 | Tragic 2.4% |
| Spaniards | 0.1 /100 | #272 | Tragic 2.4% |
| Immigrants | Bahamas | 0.1 /100 | #273 | Tragic 2.4% |
| Immigrants | Latin America | 0.0 /100 | #274 | Tragic 2.4% |
| Chippewa | 0.0 /100 | #275 | Tragic 2.4% |
| Scotch-Irish | 0.0 /100 | #276 | Tragic 2.4% |
| Bahamians | 0.0 /100 | #277 | Tragic 2.4% |
| Spanish | 0.0 /100 | #278 | Tragic 2.4% |
| Nepalese | 0.0 /100 | #279 | Tragic 2.4% |
| Cape Verdeans | 0.0 /100 | #280 | Tragic 2.4% |
| U.S. Virgin Islanders | 0.0 /100 | #281 | Tragic 2.5% |
| Immigrants | Caribbean | 0.0 /100 | #282 | Tragic 2.5% |
| Puget Sound Salish | 0.0 /100 | #283 | Tragic 2.5% |
| Yakama | 0.0 /100 | #284 | Tragic 2.5% |
| Immigrants | Central America | 0.0 /100 | #285 | Tragic 2.5% |
| Sioux | 0.0 /100 | #286 | Tragic 2.5% |