Immigrants from Malaysia vs Sioux Births to Unmarried Women
COMPARE
Immigrants from Malaysia
Sioux
Births to Unmarried Women
Births to Unmarried Women Comparison
Immigrants from Malaysia
Sioux
27.4%
BIRTHS TO UNMARRIED WOMEN
99.7/ 100
METRIC RATING
39th/ 347
METRIC RANK
41.0%
BIRTHS TO UNMARRIED WOMEN
0.0/ 100
METRIC RATING
323rd/ 347
METRIC RANK
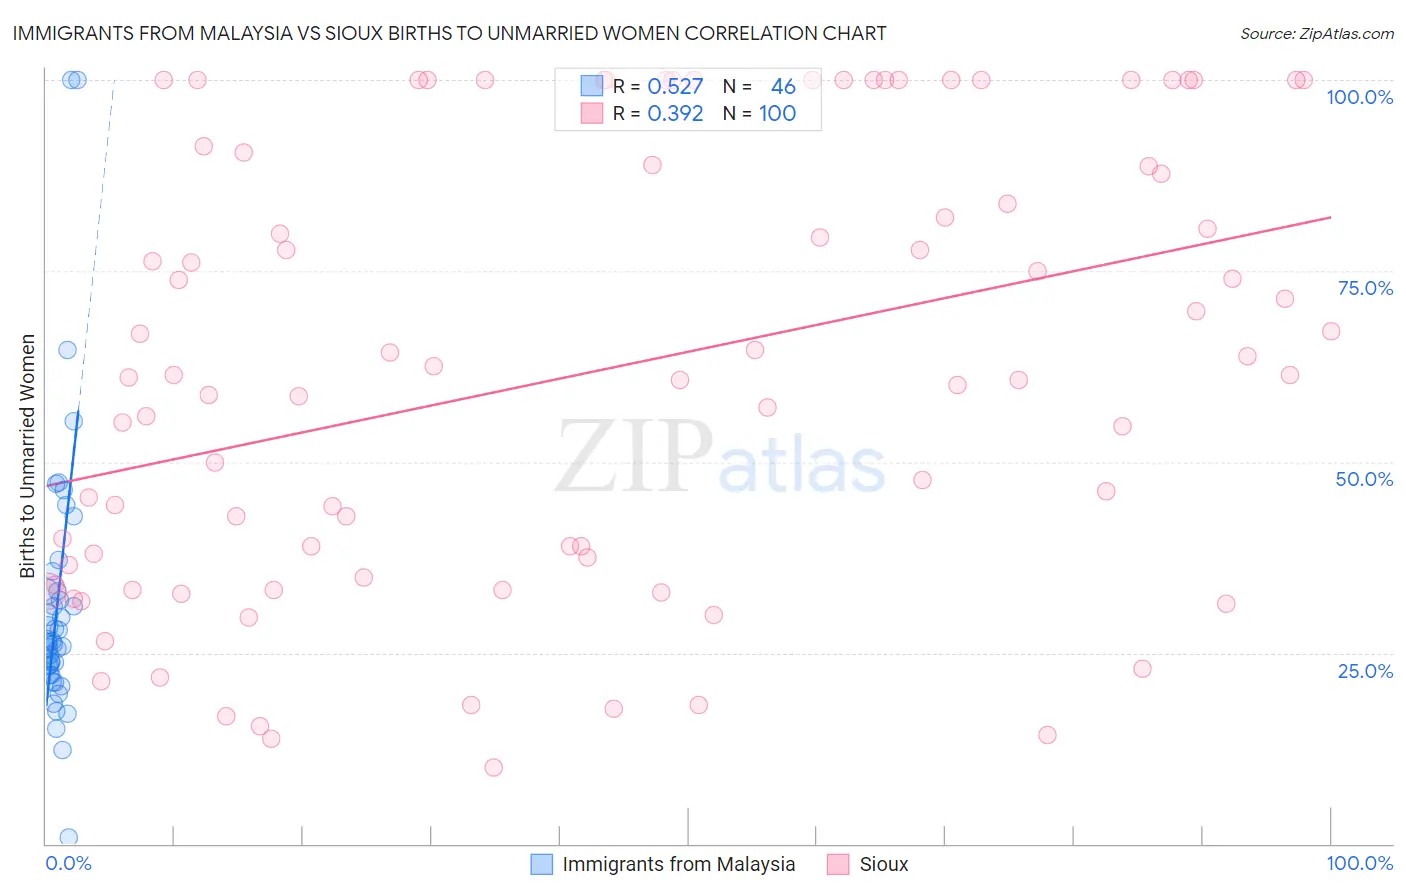
Immigrants from Malaysia vs Sioux Births to Unmarried Women Correlation Chart
The statistical analysis conducted on geographies consisting of 189,196,232 people shows a substantial positive correlation between the proportion of Immigrants from Malaysia and percentage of births to unmarried women in the United States with a correlation coefficient (R) of 0.527 and weighted average of 27.4%. Similarly, the statistical analysis conducted on geographies consisting of 224,573,646 people shows a mild positive correlation between the proportion of Sioux and percentage of births to unmarried women in the United States with a correlation coefficient (R) of 0.392 and weighted average of 41.0%, a difference of 49.8%.
Births to Unmarried Women Correlation Summary
| Measurement | Immigrants from Malaysia | Sioux |
| Minimum | 0.90% | 10.0% |
| Maximum | 100.0% | 100.0% |
| Range | 99.1% | 90.0% |
| Mean | 31.7% | 61.9% |
| Median | 26.4% | 61.2% |
| Interquartile 25% (IQ1) | 22.1% | 35.7% |
| Interquartile 75% (IQ3) | 33.1% | 89.7% |
| Interquartile Range (IQR) | 11.1% | 54.0% |
| Standard Deviation (Sample) | 18.6% | 28.7% |
| Standard Deviation (Population) | 18.4% | 28.5% |
Similar Demographics by Births to Unmarried Women
Demographics Similar to Immigrants from Malaysia by Births to Unmarried Women
In terms of births to unmarried women, the demographic groups most similar to Immigrants from Malaysia are Immigrants from Moldova (27.3%, a difference of 0.28%), Turkish (27.4%, a difference of 0.32%), Immigrants from Ukraine (27.2%, a difference of 0.43%), Immigrants from Western Asia (27.2%, a difference of 0.51%), and Immigrants from Ireland (27.2%, a difference of 0.59%).
| Demographics | Rating | Rank | Births to Unmarried Women |
| Immigrants | Russia | 99.8 /100 | #32 | Exceptional 27.1% |
| Immigrants | Sri Lanka | 99.8 /100 | #33 | Exceptional 27.2% |
| Immigrants | Pakistan | 99.8 /100 | #34 | Exceptional 27.2% |
| Immigrants | Ireland | 99.7 /100 | #35 | Exceptional 27.2% |
| Immigrants | Western Asia | 99.7 /100 | #36 | Exceptional 27.2% |
| Immigrants | Ukraine | 99.7 /100 | #37 | Exceptional 27.2% |
| Immigrants | Moldova | 99.7 /100 | #38 | Exceptional 27.3% |
| Immigrants | Malaysia | 99.7 /100 | #39 | Exceptional 27.4% |
| Turks | 99.6 /100 | #40 | Exceptional 27.4% |
| Iraqis | 99.6 /100 | #41 | Exceptional 27.6% |
| Immigrants | Eastern Europe | 99.6 /100 | #42 | Exceptional 27.6% |
| Immigrants | Bulgaria | 99.6 /100 | #43 | Exceptional 27.6% |
| Immigrants | Indonesia | 99.5 /100 | #44 | Exceptional 27.7% |
| Latvians | 99.5 /100 | #45 | Exceptional 27.7% |
| Immigrants | Lithuania | 99.5 /100 | #46 | Exceptional 27.7% |
Demographics Similar to Sioux by Births to Unmarried Women
In terms of births to unmarried women, the demographic groups most similar to Sioux are Cajun (41.0%, a difference of 0.070%), Bahamian (40.8%, a difference of 0.56%), Cape Verdean (41.3%, a difference of 0.80%), Cheyenne (41.3%, a difference of 0.85%), and Immigrants from Cuba (41.5%, a difference of 1.1%).
| Demographics | Rating | Rank | Births to Unmarried Women |
| Apache | 0.0 /100 | #316 | Tragic 39.9% |
| Immigrants | Dominican Republic | 0.0 /100 | #317 | Tragic 40.1% |
| Immigrants | Bahamas | 0.0 /100 | #318 | Tragic 40.1% |
| Yakama | 0.0 /100 | #319 | Tragic 40.3% |
| Crow | 0.0 /100 | #320 | Tragic 40.4% |
| Bahamians | 0.0 /100 | #321 | Tragic 40.8% |
| Cajuns | 0.0 /100 | #322 | Tragic 41.0% |
| Sioux | 0.0 /100 | #323 | Tragic 41.0% |
| Cape Verdeans | 0.0 /100 | #324 | Tragic 41.3% |
| Cheyenne | 0.0 /100 | #325 | Tragic 41.3% |
| Immigrants | Cuba | 0.0 /100 | #326 | Tragic 41.5% |
| Tsimshian | 0.0 /100 | #327 | Tragic 42.2% |
| Immigrants | Cabo Verde | 0.0 /100 | #328 | Tragic 42.2% |
| Paiute | 0.0 /100 | #329 | Tragic 42.5% |
| Chippewa | 0.0 /100 | #330 | Tragic 42.6% |