Ugandan vs Lebanese Average Family Size
COMPARE
Ugandan
Lebanese
Average Family Size
Average Family Size Comparison
Ugandans
Lebanese
3.23
AVERAGE FAMILY SIZE
58.4/ 100
METRIC RATING
165th/ 347
METRIC RANK
3.19
AVERAGE FAMILY SIZE
9.1/ 100
METRIC RATING
220th/ 347
METRIC RANK
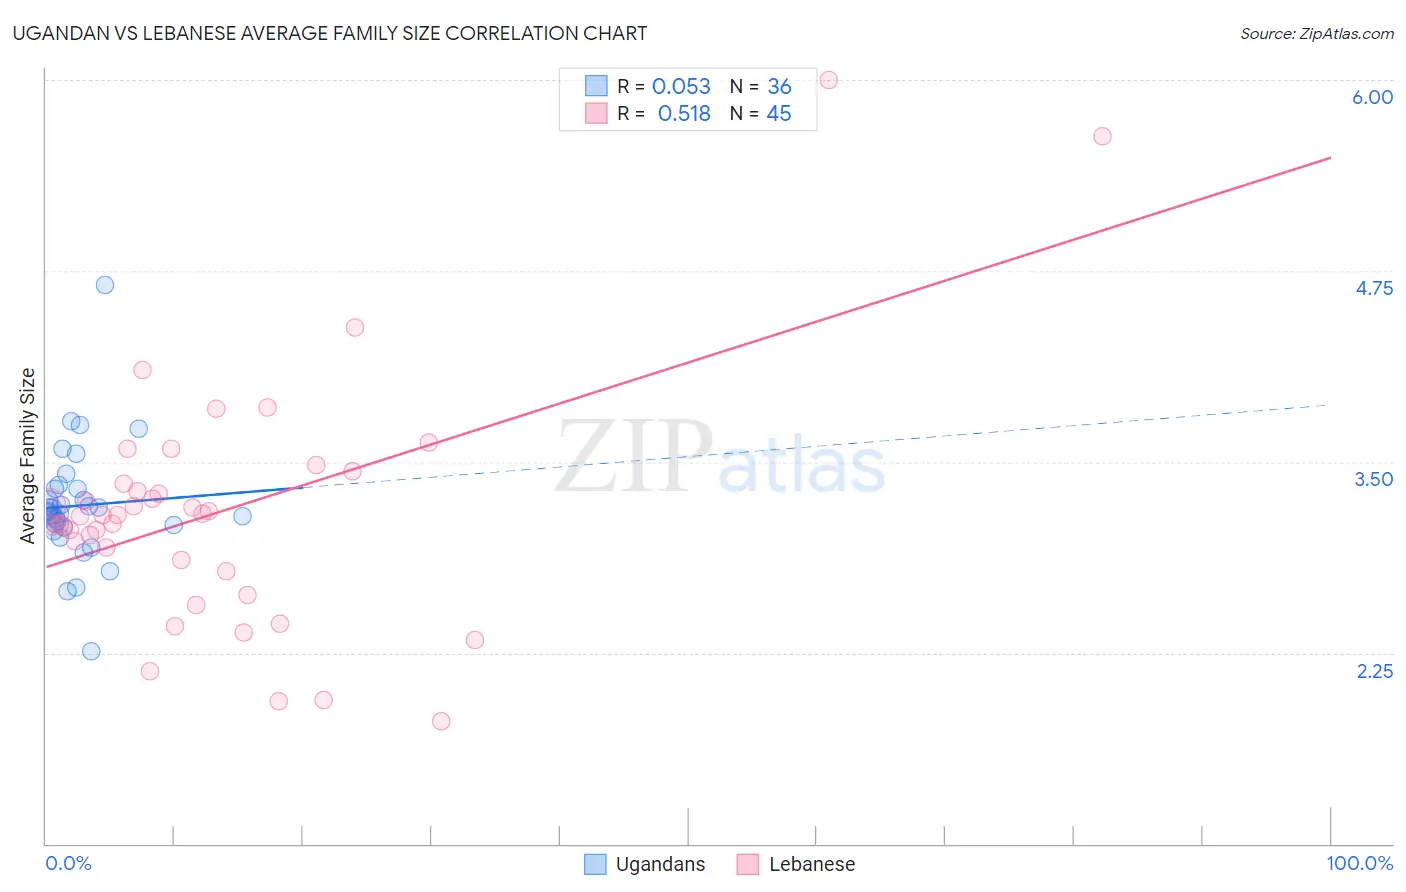
Ugandan vs Lebanese Average Family Size Correlation Chart
The statistical analysis conducted on geographies consisting of 93,998,632 people shows a slight positive correlation between the proportion of Ugandans and average family size in the United States with a correlation coefficient (R) of 0.053 and weighted average of 3.23. Similarly, the statistical analysis conducted on geographies consisting of 401,332,213 people shows a substantial positive correlation between the proportion of Lebanese and average family size in the United States with a correlation coefficient (R) of 0.518 and weighted average of 3.19, a difference of 1.2%.
Average Family Size Correlation Summary
| Measurement | Ugandan | Lebanese |
| Minimum | 2.26 | 1.80 |
| Maximum | 4.66 | 6.00 |
| Range | 2.40 | 4.20 |
| Mean | 3.21 | 3.18 |
| Median | 3.17 | 3.15 |
| Interquartile 25% (IQ1) | 3.08 | 2.82 |
| Interquartile 75% (IQ3) | 3.33 | 3.40 |
| Interquartile Range (IQR) | 0.25 | 0.58 |
| Standard Deviation (Sample) | 0.39 | 0.79 |
| Standard Deviation (Population) | 0.38 | 0.78 |
Similar Demographics by Average Family Size
Demographics Similar to Ugandans by Average Family Size
In terms of average family size, the demographic groups most similar to Ugandans are Egyptian (3.23, a difference of 0.0%), Uruguayan (3.23, a difference of 0.010%), Immigrants from Senegal (3.23, a difference of 0.020%), Immigrants from Uganda (3.23, a difference of 0.030%), and Dutch West Indian (3.23, a difference of 0.030%).
| Demographics | Rating | Rank | Average Family Size |
| Iraqis | 64.3 /100 | #158 | Good 3.24 |
| Ethiopians | 63.9 /100 | #159 | Good 3.24 |
| Immigrants | Iraq | 63.7 /100 | #160 | Good 3.24 |
| Immigrants | Chile | 63.2 /100 | #161 | Good 3.24 |
| Immigrants | Uganda | 60.1 /100 | #162 | Good 3.23 |
| Uruguayans | 58.8 /100 | #163 | Average 3.23 |
| Egyptians | 58.6 /100 | #164 | Average 3.23 |
| Ugandans | 58.4 /100 | #165 | Average 3.23 |
| Immigrants | Senegal | 57.5 /100 | #166 | Average 3.23 |
| Dutch West Indians | 56.9 /100 | #167 | Average 3.23 |
| Taiwanese | 54.2 /100 | #168 | Average 3.23 |
| Aleuts | 54.1 /100 | #169 | Average 3.23 |
| Arabs | 53.8 /100 | #170 | Average 3.23 |
| Chileans | 53.2 /100 | #171 | Average 3.23 |
| Immigrants | Congo | 52.7 /100 | #172 | Average 3.23 |
Demographics Similar to Lebanese by Average Family Size
In terms of average family size, the demographic groups most similar to Lebanese are Pennsylvania German (3.19, a difference of 0.010%), French American Indian (3.20, a difference of 0.040%), Immigrants from Somalia (3.20, a difference of 0.060%), Delaware (3.20, a difference of 0.10%), and Bermudan (3.20, a difference of 0.10%).
| Demographics | Rating | Rank | Average Family Size |
| Mongolians | 11.5 /100 | #213 | Poor 3.20 |
| Somalis | 11.2 /100 | #214 | Poor 3.20 |
| Delaware | 11.1 /100 | #215 | Poor 3.20 |
| Bermudans | 11.0 /100 | #216 | Poor 3.20 |
| Immigrants | Somalia | 10.3 /100 | #217 | Poor 3.20 |
| French American Indians | 9.8 /100 | #218 | Tragic 3.20 |
| Pennsylvania Germans | 9.3 /100 | #219 | Tragic 3.19 |
| Lebanese | 9.1 /100 | #220 | Tragic 3.19 |
| Immigrants | Ukraine | 7.2 /100 | #221 | Tragic 3.19 |
| Immigrants | Kuwait | 7.2 /100 | #222 | Tragic 3.19 |
| Immigrants | Zimbabwe | 7.1 /100 | #223 | Tragic 3.19 |
| Syrians | 6.5 /100 | #224 | Tragic 3.19 |
| Cree | 6.2 /100 | #225 | Tragic 3.19 |
| Chickasaw | 6.0 /100 | #226 | Tragic 3.19 |
| Portuguese | 6.0 /100 | #227 | Tragic 3.19 |