Brazilian vs Soviet Union Average Family Size
COMPARE
Brazilian
Soviet Union
Average Family Size
Average Family Size Comparison
Brazilians
Soviet Union
3.18
AVERAGE FAMILY SIZE
4.5/ 100
METRIC RATING
233rd/ 347
METRIC RANK
3.11
AVERAGE FAMILY SIZE
0.0/ 100
METRIC RATING
323rd/ 347
METRIC RANK
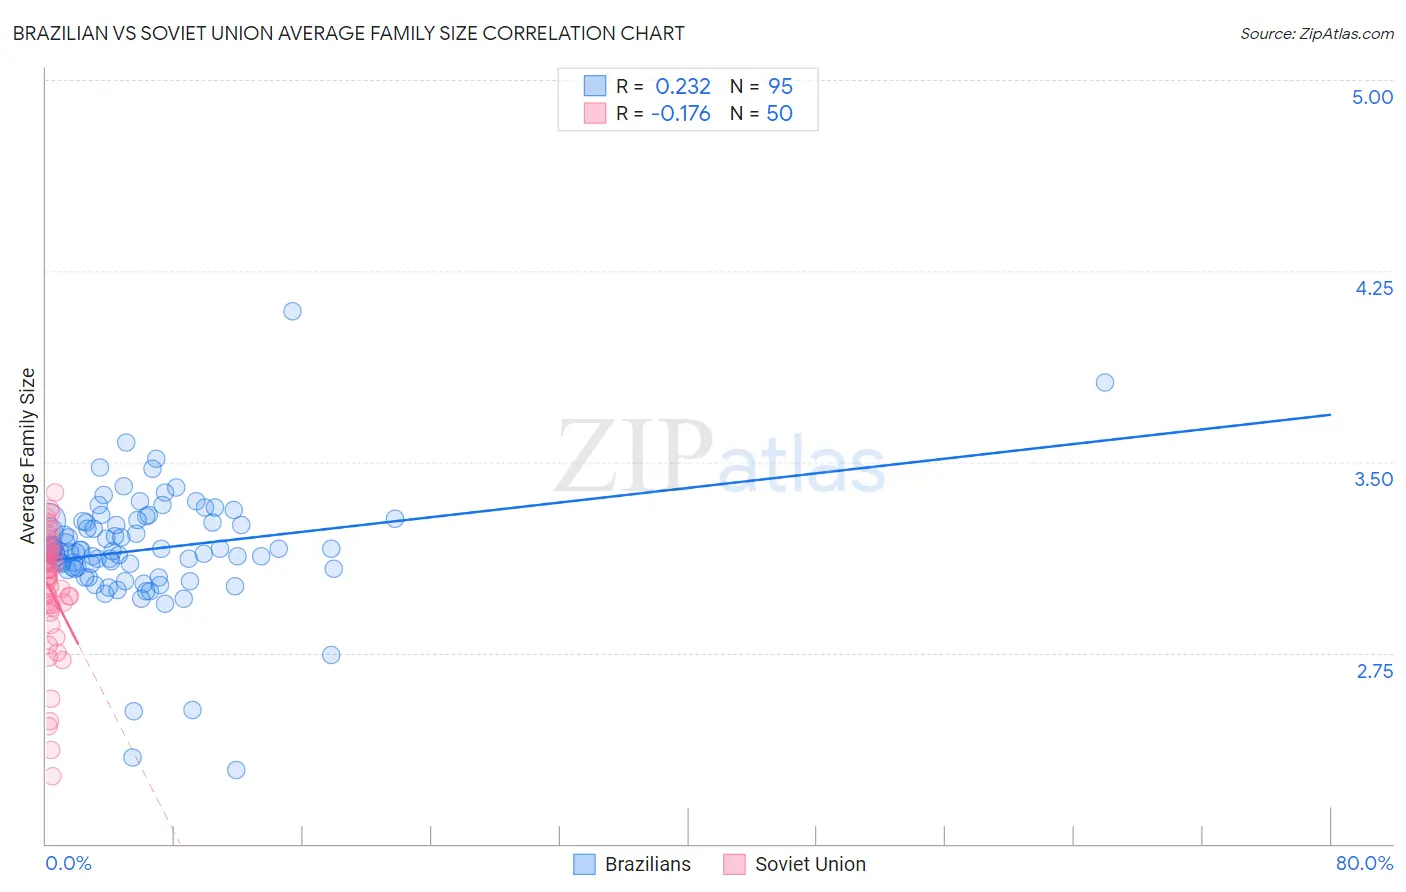
Brazilian vs Soviet Union Average Family Size Correlation Chart
The statistical analysis conducted on geographies consisting of 323,732,012 people shows a weak positive correlation between the proportion of Brazilians and average family size in the United States with a correlation coefficient (R) of 0.232 and weighted average of 3.18. Similarly, the statistical analysis conducted on geographies consisting of 43,509,630 people shows a poor negative correlation between the proportion of Soviet Union and average family size in the United States with a correlation coefficient (R) of -0.176 and weighted average of 3.11, a difference of 2.2%.
Average Family Size Correlation Summary
| Measurement | Brazilian | Soviet Union |
| Minimum | 2.29 | 2.27 |
| Maximum | 4.09 | 3.38 |
| Range | 1.80 | 1.11 |
| Mean | 3.16 | 2.99 |
| Median | 3.15 | 3.05 |
| Interquartile 25% (IQ1) | 3.08 | 2.93 |
| Interquartile 75% (IQ3) | 3.26 | 3.15 |
| Interquartile Range (IQR) | 0.19 | 0.22 |
| Standard Deviation (Sample) | 0.24 | 0.24 |
| Standard Deviation (Population) | 0.24 | 0.24 |
Similar Demographics by Average Family Size
Demographics Similar to Brazilians by Average Family Size
In terms of average family size, the demographic groups most similar to Brazilians are Iranian (3.18, a difference of 0.0%), Cherokee (3.18, a difference of 0.020%), Immigrants from Turkey (3.18, a difference of 0.030%), Immigrants from Portugal (3.18, a difference of 0.040%), and Icelander (3.19, a difference of 0.070%).
| Demographics | Rating | Rank | Average Family Size |
| Chickasaw | 6.0 /100 | #226 | Tragic 3.19 |
| Portuguese | 6.0 /100 | #227 | Tragic 3.19 |
| Immigrants | Nonimmigrants | 5.7 /100 | #228 | Tragic 3.19 |
| Immigrants | Italy | 5.3 /100 | #229 | Tragic 3.19 |
| Icelanders | 5.2 /100 | #230 | Tragic 3.19 |
| Basques | 5.2 /100 | #231 | Tragic 3.19 |
| Cherokee | 4.7 /100 | #232 | Tragic 3.18 |
| Brazilians | 4.5 /100 | #233 | Tragic 3.18 |
| Iranians | 4.5 /100 | #234 | Tragic 3.18 |
| Immigrants | Turkey | 4.2 /100 | #235 | Tragic 3.18 |
| Immigrants | Portugal | 4.2 /100 | #236 | Tragic 3.18 |
| Immigrants | Romania | 3.7 /100 | #237 | Tragic 3.18 |
| Romanians | 3.7 /100 | #238 | Tragic 3.18 |
| Houma | 3.4 /100 | #239 | Tragic 3.18 |
| Osage | 3.2 /100 | #240 | Tragic 3.18 |
Demographics Similar to Soviet Union by Average Family Size
In terms of average family size, the demographic groups most similar to Soviet Union are Immigrants from Austria (3.12, a difference of 0.030%), Immigrants from Canada (3.12, a difference of 0.030%), Immigrants from North America (3.12, a difference of 0.060%), Celtic (3.11, a difference of 0.080%), and English (3.11, a difference of 0.12%).
| Demographics | Rating | Rank | Average Family Size |
| Serbians | 0.1 /100 | #316 | Tragic 3.12 |
| Italians | 0.1 /100 | #317 | Tragic 3.12 |
| Eastern Europeans | 0.1 /100 | #318 | Tragic 3.12 |
| Welsh | 0.1 /100 | #319 | Tragic 3.12 |
| Immigrants | North America | 0.0 /100 | #320 | Tragic 3.12 |
| Immigrants | Austria | 0.0 /100 | #321 | Tragic 3.12 |
| Immigrants | Canada | 0.0 /100 | #322 | Tragic 3.12 |
| Soviet Union | 0.0 /100 | #323 | Tragic 3.11 |
| Celtics | 0.0 /100 | #324 | Tragic 3.11 |
| English | 0.0 /100 | #325 | Tragic 3.11 |
| Ottawa | 0.0 /100 | #326 | Tragic 3.11 |
| Dutch | 0.0 /100 | #327 | Tragic 3.11 |
| Czechs | 0.0 /100 | #328 | Tragic 3.11 |
| Belgians | 0.0 /100 | #329 | Tragic 3.11 |
| Latvians | 0.0 /100 | #330 | Tragic 3.11 |