Ugandan vs South American Average Family Size
COMPARE
Ugandan
South American
Average Family Size
Average Family Size Comparison
Ugandans
South Americans
3.23
AVERAGE FAMILY SIZE
58.4/ 100
METRIC RATING
165th/ 347
METRIC RANK
3.27
AVERAGE FAMILY SIZE
95.1/ 100
METRIC RATING
114th/ 347
METRIC RANK
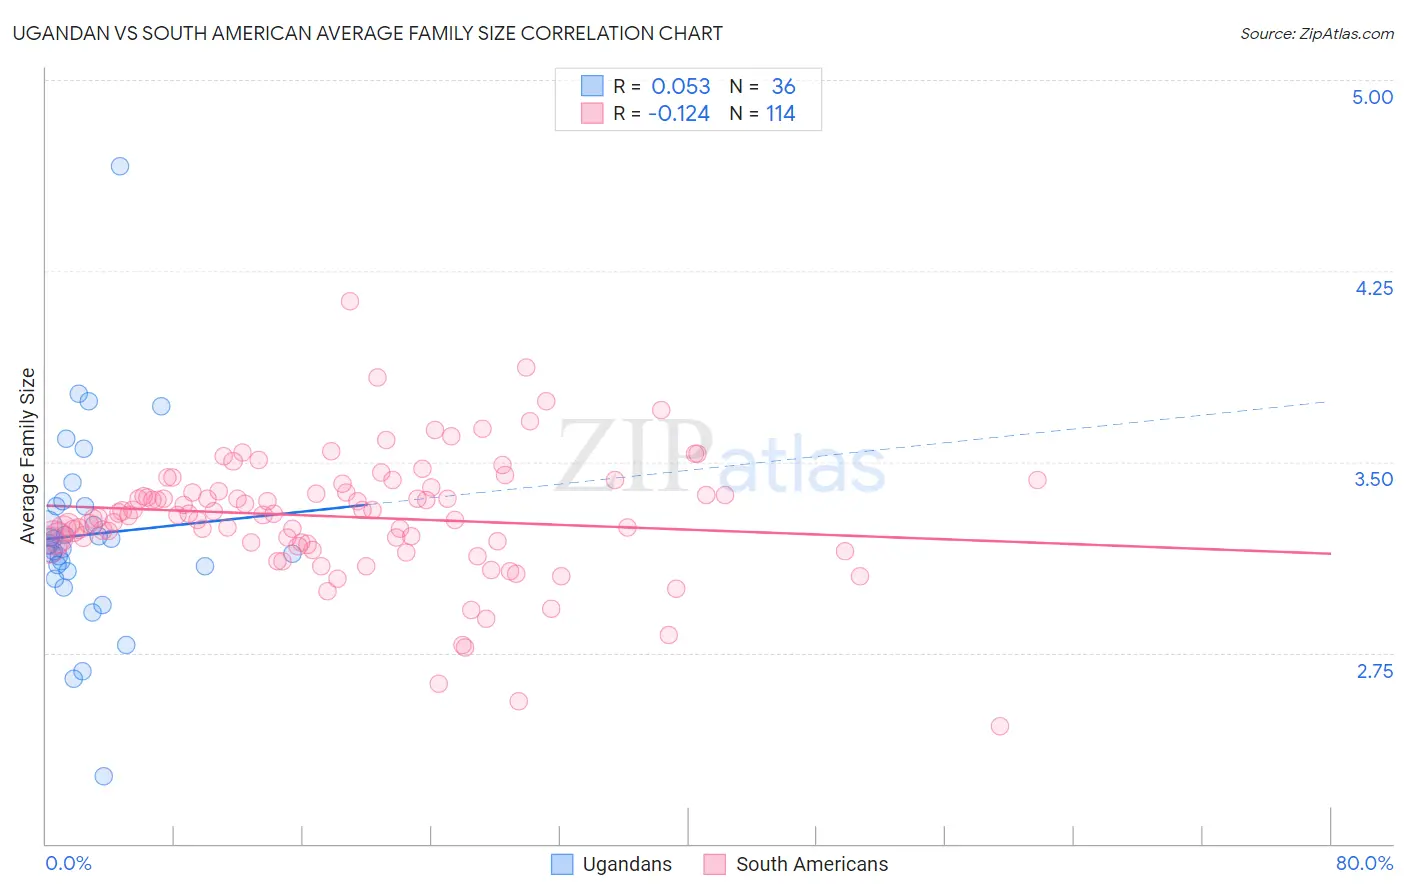
Ugandan vs South American Average Family Size Correlation Chart
The statistical analysis conducted on geographies consisting of 93,998,632 people shows a slight positive correlation between the proportion of Ugandans and average family size in the United States with a correlation coefficient (R) of 0.053 and weighted average of 3.23. Similarly, the statistical analysis conducted on geographies consisting of 493,671,648 people shows a poor negative correlation between the proportion of South Americans and average family size in the United States with a correlation coefficient (R) of -0.124 and weighted average of 3.27, a difference of 1.2%.
Average Family Size Correlation Summary
| Measurement | Ugandan | South American |
| Minimum | 2.26 | 2.46 |
| Maximum | 4.66 | 4.13 |
| Range | 2.40 | 1.67 |
| Mean | 3.21 | 3.28 |
| Median | 3.17 | 3.29 |
| Interquartile 25% (IQ1) | 3.08 | 3.18 |
| Interquartile 75% (IQ3) | 3.33 | 3.39 |
| Interquartile Range (IQR) | 0.25 | 0.20 |
| Standard Deviation (Sample) | 0.39 | 0.24 |
| Standard Deviation (Population) | 0.38 | 0.24 |
Similar Demographics by Average Family Size
Demographics Similar to Ugandans by Average Family Size
In terms of average family size, the demographic groups most similar to Ugandans are Egyptian (3.23, a difference of 0.0%), Uruguayan (3.23, a difference of 0.010%), Immigrants from Senegal (3.23, a difference of 0.020%), Immigrants from Uganda (3.23, a difference of 0.030%), and Dutch West Indian (3.23, a difference of 0.030%).
| Demographics | Rating | Rank | Average Family Size |
| Iraqis | 64.3 /100 | #158 | Good 3.24 |
| Ethiopians | 63.9 /100 | #159 | Good 3.24 |
| Immigrants | Iraq | 63.7 /100 | #160 | Good 3.24 |
| Immigrants | Chile | 63.2 /100 | #161 | Good 3.24 |
| Immigrants | Uganda | 60.1 /100 | #162 | Good 3.23 |
| Uruguayans | 58.8 /100 | #163 | Average 3.23 |
| Egyptians | 58.6 /100 | #164 | Average 3.23 |
| Ugandans | 58.4 /100 | #165 | Average 3.23 |
| Immigrants | Senegal | 57.5 /100 | #166 | Average 3.23 |
| Dutch West Indians | 56.9 /100 | #167 | Average 3.23 |
| Taiwanese | 54.2 /100 | #168 | Average 3.23 |
| Aleuts | 54.1 /100 | #169 | Average 3.23 |
| Arabs | 53.8 /100 | #170 | Average 3.23 |
| Chileans | 53.2 /100 | #171 | Average 3.23 |
| Immigrants | Congo | 52.7 /100 | #172 | Average 3.23 |
Demographics Similar to South Americans by Average Family Size
In terms of average family size, the demographic groups most similar to South Americans are Immigrants from Liberia (3.27, a difference of 0.010%), Immigrants from South America (3.27, a difference of 0.010%), Kiowa (3.27, a difference of 0.030%), Immigrants from Panama (3.27, a difference of 0.050%), and Black/African American (3.27, a difference of 0.060%).
| Demographics | Rating | Rank | Average Family Size |
| Ghanaians | 98.0 /100 | #107 | Exceptional 3.29 |
| Asians | 97.0 /100 | #108 | Exceptional 3.28 |
| Puerto Ricans | 96.7 /100 | #109 | Exceptional 3.28 |
| Bahamians | 96.6 /100 | #110 | Exceptional 3.28 |
| Indonesians | 96.2 /100 | #111 | Exceptional 3.28 |
| Blacks/African Americans | 95.7 /100 | #112 | Exceptional 3.27 |
| Immigrants | Panama | 95.6 /100 | #113 | Exceptional 3.27 |
| South Americans | 95.1 /100 | #114 | Exceptional 3.27 |
| Immigrants | Liberia | 95.0 /100 | #115 | Exceptional 3.27 |
| Immigrants | South America | 95.0 /100 | #116 | Exceptional 3.27 |
| Kiowa | 94.8 /100 | #117 | Exceptional 3.27 |
| Immigrants | Asia | 94.0 /100 | #118 | Exceptional 3.27 |
| Immigrants | Indonesia | 93.7 /100 | #119 | Exceptional 3.27 |
| Immigrants | Bahamas | 93.6 /100 | #120 | Exceptional 3.27 |
| Immigrants | Thailand | 93.3 /100 | #121 | Exceptional 3.27 |