Native Hawaiian vs Soviet Union Average Family Size
COMPARE
Native Hawaiian
Soviet Union
Average Family Size
Average Family Size Comparison
Native Hawaiians
Soviet Union
3.43
AVERAGE FAMILY SIZE
100.0/ 100
METRIC RATING
26th/ 347
METRIC RANK
3.11
AVERAGE FAMILY SIZE
0.0/ 100
METRIC RATING
323rd/ 347
METRIC RANK
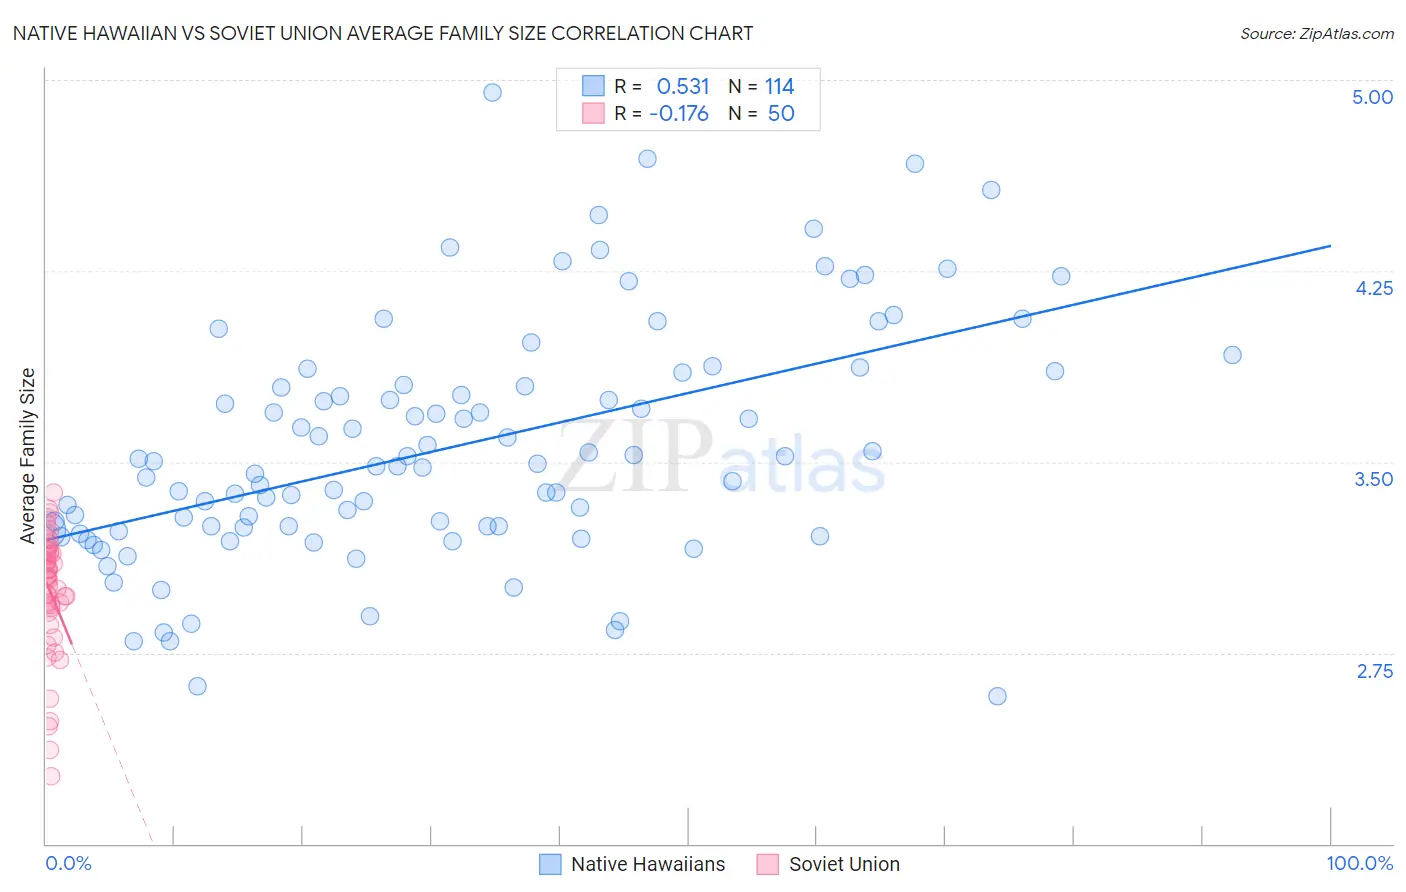
Native Hawaiian vs Soviet Union Average Family Size Correlation Chart
The statistical analysis conducted on geographies consisting of 331,878,111 people shows a substantial positive correlation between the proportion of Native Hawaiians and average family size in the United States with a correlation coefficient (R) of 0.531 and weighted average of 3.43. Similarly, the statistical analysis conducted on geographies consisting of 43,509,630 people shows a poor negative correlation between the proportion of Soviet Union and average family size in the United States with a correlation coefficient (R) of -0.176 and weighted average of 3.11, a difference of 10.1%.
Average Family Size Correlation Summary
| Measurement | Native Hawaiian | Soviet Union |
| Minimum | 2.58 | 2.27 |
| Maximum | 4.95 | 3.38 |
| Range | 2.37 | 1.11 |
| Mean | 3.56 | 2.99 |
| Median | 3.49 | 3.05 |
| Interquartile 25% (IQ1) | 3.24 | 2.93 |
| Interquartile 75% (IQ3) | 3.80 | 3.15 |
| Interquartile Range (IQR) | 0.56 | 0.22 |
| Standard Deviation (Sample) | 0.47 | 0.24 |
| Standard Deviation (Population) | 0.46 | 0.24 |
Similar Demographics by Average Family Size
Demographics Similar to Native Hawaiians by Average Family Size
In terms of average family size, the demographic groups most similar to Native Hawaiians are Mexican American Indian (3.43, a difference of 0.010%), Immigrants from Latin America (3.42, a difference of 0.13%), Nepalese (3.42, a difference of 0.22%), Samoan (3.42, a difference of 0.25%), and Central American (3.41, a difference of 0.45%).
| Demographics | Rating | Rank | Average Family Size |
| Mexicans | 100.0 /100 | #19 | Exceptional 3.48 |
| Cheyenne | 100.0 /100 | #20 | Exceptional 3.47 |
| Yuman | 100.0 /100 | #21 | Exceptional 3.47 |
| Apache | 100.0 /100 | #22 | Exceptional 3.46 |
| Immigrants | Fiji | 100.0 /100 | #23 | Exceptional 3.45 |
| Natives/Alaskans | 100.0 /100 | #24 | Exceptional 3.45 |
| Yakama | 100.0 /100 | #25 | Exceptional 3.45 |
| Native Hawaiians | 100.0 /100 | #26 | Exceptional 3.43 |
| Mexican American Indians | 100.0 /100 | #27 | Exceptional 3.43 |
| Immigrants | Latin America | 100.0 /100 | #28 | Exceptional 3.42 |
| Nepalese | 100.0 /100 | #29 | Exceptional 3.42 |
| Samoans | 100.0 /100 | #30 | Exceptional 3.42 |
| Central Americans | 100.0 /100 | #31 | Exceptional 3.41 |
| Immigrants | Guatemala | 100.0 /100 | #32 | Exceptional 3.41 |
| Hawaiians | 100.0 /100 | #33 | Exceptional 3.41 |
Demographics Similar to Soviet Union by Average Family Size
In terms of average family size, the demographic groups most similar to Soviet Union are Immigrants from Austria (3.12, a difference of 0.030%), Immigrants from Canada (3.12, a difference of 0.030%), Immigrants from North America (3.12, a difference of 0.060%), Celtic (3.11, a difference of 0.080%), and English (3.11, a difference of 0.12%).
| Demographics | Rating | Rank | Average Family Size |
| Serbians | 0.1 /100 | #316 | Tragic 3.12 |
| Italians | 0.1 /100 | #317 | Tragic 3.12 |
| Eastern Europeans | 0.1 /100 | #318 | Tragic 3.12 |
| Welsh | 0.1 /100 | #319 | Tragic 3.12 |
| Immigrants | North America | 0.0 /100 | #320 | Tragic 3.12 |
| Immigrants | Austria | 0.0 /100 | #321 | Tragic 3.12 |
| Immigrants | Canada | 0.0 /100 | #322 | Tragic 3.12 |
| Soviet Union | 0.0 /100 | #323 | Tragic 3.11 |
| Celtics | 0.0 /100 | #324 | Tragic 3.11 |
| English | 0.0 /100 | #325 | Tragic 3.11 |
| Ottawa | 0.0 /100 | #326 | Tragic 3.11 |
| Dutch | 0.0 /100 | #327 | Tragic 3.11 |
| Czechs | 0.0 /100 | #328 | Tragic 3.11 |
| Belgians | 0.0 /100 | #329 | Tragic 3.11 |
| Latvians | 0.0 /100 | #330 | Tragic 3.11 |