Ugandan vs British West Indian Average Family Size
COMPARE
Ugandan
British West Indian
Average Family Size
Average Family Size Comparison
Ugandans
British West Indians
3.23
AVERAGE FAMILY SIZE
58.4/ 100
METRIC RATING
165th/ 347
METRIC RANK
3.32
AVERAGE FAMILY SIZE
99.8/ 100
METRIC RATING
79th/ 347
METRIC RANK
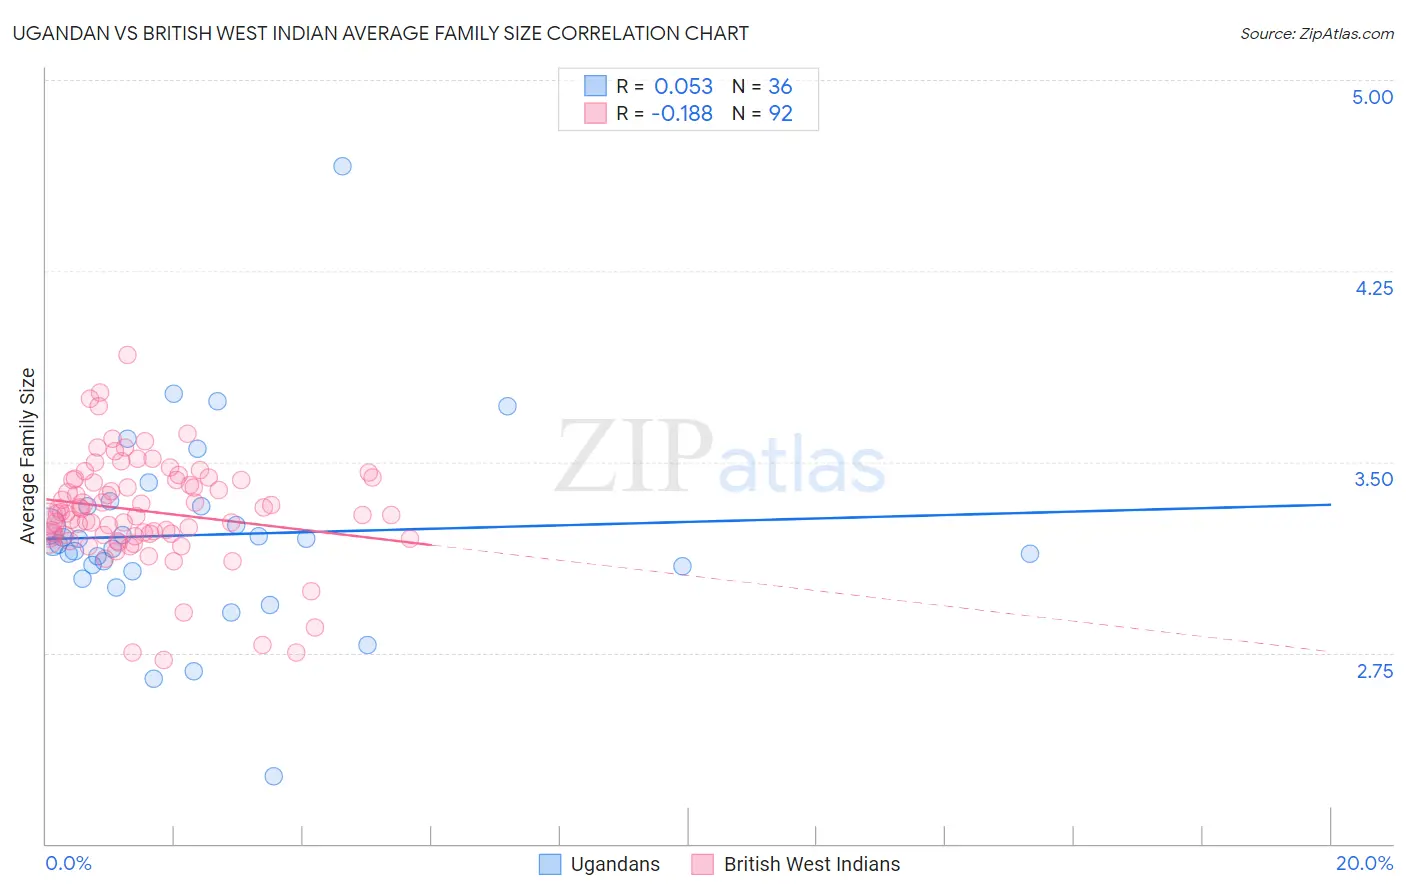
Ugandan vs British West Indian Average Family Size Correlation Chart
The statistical analysis conducted on geographies consisting of 93,998,632 people shows a slight positive correlation between the proportion of Ugandans and average family size in the United States with a correlation coefficient (R) of 0.053 and weighted average of 3.23. Similarly, the statistical analysis conducted on geographies consisting of 152,638,321 people shows a poor negative correlation between the proportion of British West Indians and average family size in the United States with a correlation coefficient (R) of -0.188 and weighted average of 3.32, a difference of 2.7%.
Average Family Size Correlation Summary
| Measurement | Ugandan | British West Indian |
| Minimum | 2.26 | 2.72 |
| Maximum | 4.66 | 3.92 |
| Range | 2.40 | 1.20 |
| Mean | 3.21 | 3.31 |
| Median | 3.17 | 3.30 |
| Interquartile 25% (IQ1) | 3.08 | 3.21 |
| Interquartile 75% (IQ3) | 3.33 | 3.43 |
| Interquartile Range (IQR) | 0.25 | 0.22 |
| Standard Deviation (Sample) | 0.39 | 0.21 |
| Standard Deviation (Population) | 0.38 | 0.21 |
Similar Demographics by Average Family Size
Demographics Similar to Ugandans by Average Family Size
In terms of average family size, the demographic groups most similar to Ugandans are Egyptian (3.23, a difference of 0.0%), Uruguayan (3.23, a difference of 0.010%), Immigrants from Senegal (3.23, a difference of 0.020%), Immigrants from Uganda (3.23, a difference of 0.030%), and Dutch West Indian (3.23, a difference of 0.030%).
| Demographics | Rating | Rank | Average Family Size |
| Iraqis | 64.3 /100 | #158 | Good 3.24 |
| Ethiopians | 63.9 /100 | #159 | Good 3.24 |
| Immigrants | Iraq | 63.7 /100 | #160 | Good 3.24 |
| Immigrants | Chile | 63.2 /100 | #161 | Good 3.24 |
| Immigrants | Uganda | 60.1 /100 | #162 | Good 3.23 |
| Uruguayans | 58.8 /100 | #163 | Average 3.23 |
| Egyptians | 58.6 /100 | #164 | Average 3.23 |
| Ugandans | 58.4 /100 | #165 | Average 3.23 |
| Immigrants | Senegal | 57.5 /100 | #166 | Average 3.23 |
| Dutch West Indians | 56.9 /100 | #167 | Average 3.23 |
| Taiwanese | 54.2 /100 | #168 | Average 3.23 |
| Aleuts | 54.1 /100 | #169 | Average 3.23 |
| Arabs | 53.8 /100 | #170 | Average 3.23 |
| Chileans | 53.2 /100 | #171 | Average 3.23 |
| Immigrants | Congo | 52.7 /100 | #172 | Average 3.23 |
Demographics Similar to British West Indians by Average Family Size
In terms of average family size, the demographic groups most similar to British West Indians are Immigrants from Micronesia (3.32, a difference of 0.010%), Lumbee (3.32, a difference of 0.020%), Immigrants from Ecuador (3.32, a difference of 0.050%), Trinidadian and Tobagonian (3.32, a difference of 0.060%), and Immigrants from Dominica (3.32, a difference of 0.060%).
| Demographics | Rating | Rank | Average Family Size |
| Immigrants | Caribbean | 99.9 /100 | #72 | Exceptional 3.33 |
| Yaqui | 99.9 /100 | #73 | Exceptional 3.32 |
| Immigrants | Sierra Leone | 99.9 /100 | #74 | Exceptional 3.32 |
| Immigrants | Barbados | 99.8 /100 | #75 | Exceptional 3.32 |
| Trinidadians and Tobagonians | 99.8 /100 | #76 | Exceptional 3.32 |
| Immigrants | Ecuador | 99.8 /100 | #77 | Exceptional 3.32 |
| Immigrants | Micronesia | 99.8 /100 | #78 | Exceptional 3.32 |
| British West Indians | 99.8 /100 | #79 | Exceptional 3.32 |
| Lumbee | 99.8 /100 | #80 | Exceptional 3.32 |
| Immigrants | Dominica | 99.8 /100 | #81 | Exceptional 3.32 |
| Ecuadorians | 99.8 /100 | #82 | Exceptional 3.32 |
| Immigrants | Afghanistan | 99.8 /100 | #83 | Exceptional 3.32 |
| Immigrants | Nigeria | 99.7 /100 | #84 | Exceptional 3.32 |
| Afghans | 99.7 /100 | #85 | Exceptional 3.31 |
| Jamaicans | 99.7 /100 | #86 | Exceptional 3.31 |