Ugandan vs South American No Vehicles in Household
COMPARE
Ugandan
South American
No Vehicles in Household
No Vehicles in Household Comparison
Ugandans
South Americans
11.4%
NO VEHICLES IN HOUSEHOLD
5.3/ 100
METRIC RATING
229th/ 347
METRIC RANK
10.5%
NO VEHICLES IN HOUSEHOLD
41.9/ 100
METRIC RATING
185th/ 347
METRIC RANK
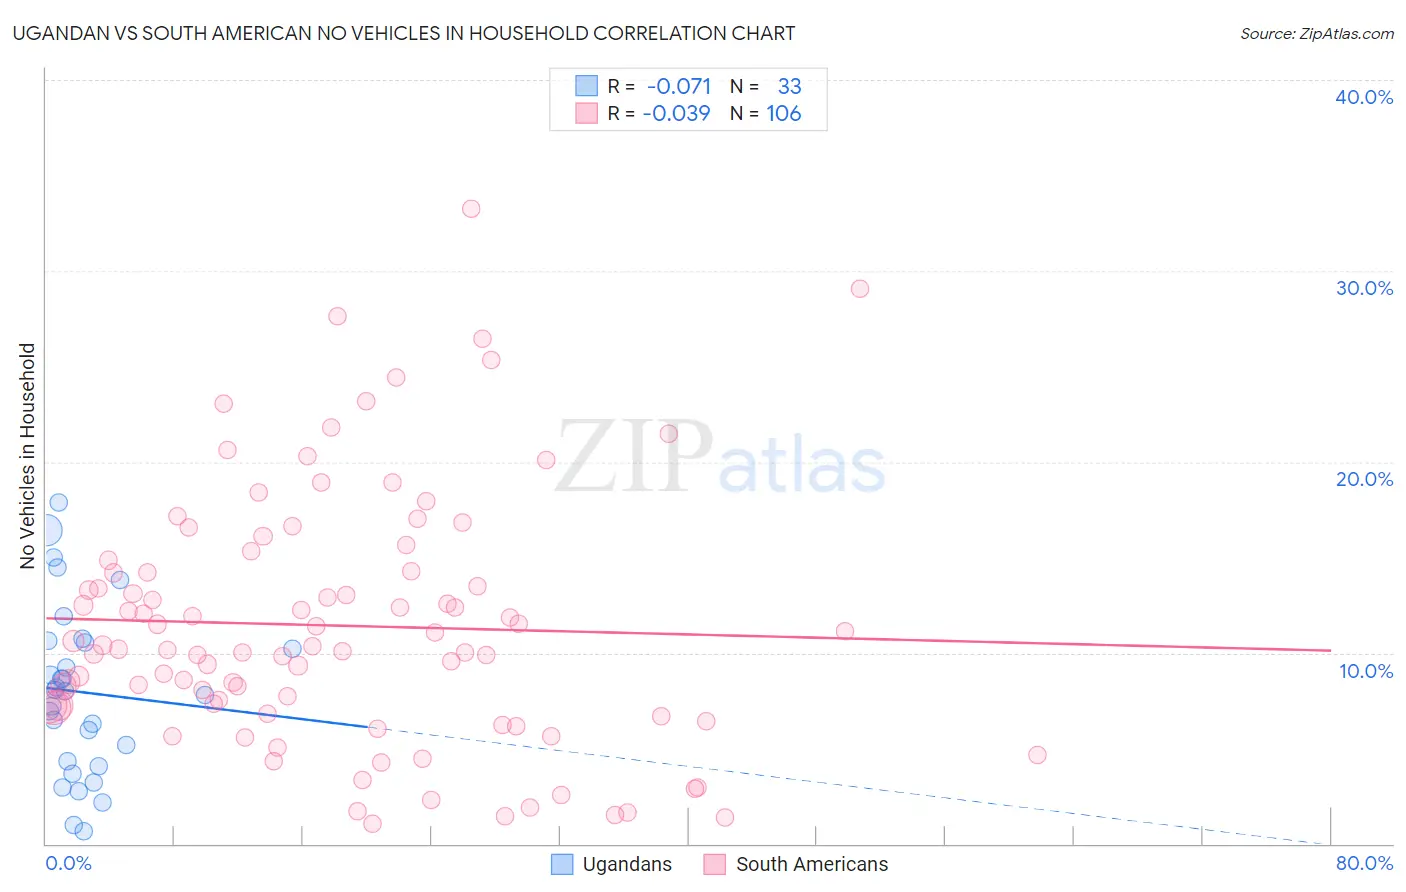
Ugandan vs South American No Vehicles in Household Correlation Chart
The statistical analysis conducted on geographies consisting of 93,973,141 people shows a slight negative correlation between the proportion of Ugandans and percentage of households with no vehicle available in the United States with a correlation coefficient (R) of -0.071 and weighted average of 11.4%. Similarly, the statistical analysis conducted on geographies consisting of 480,536,487 people shows no correlation between the proportion of South Americans and percentage of households with no vehicle available in the United States with a correlation coefficient (R) of -0.039 and weighted average of 10.5%, a difference of 8.6%.
No Vehicles in Household Correlation Summary
| Measurement | Ugandan | South American |
| Minimum | 0.63% | 1.0% |
| Maximum | 17.9% | 33.2% |
| Range | 17.2% | 32.2% |
| Mean | 7.9% | 11.4% |
| Median | 8.0% | 10.3% |
| Interquartile 25% (IQ1) | 4.2% | 7.1% |
| Interquartile 75% (IQ3) | 10.6% | 14.2% |
| Interquartile Range (IQR) | 6.4% | 7.1% |
| Standard Deviation (Sample) | 4.4% | 6.6% |
| Standard Deviation (Population) | 4.3% | 6.6% |
Similar Demographics by No Vehicles in Household
Demographics Similar to Ugandans by No Vehicles in Household
In terms of no vehicles in household, the demographic groups most similar to Ugandans are Immigrants from Romania (11.4%, a difference of 0.040%), Immigrants from Pakistan (11.4%, a difference of 0.080%), Immigrants from Somalia (11.4%, a difference of 0.10%), Immigrants from Norway (11.4%, a difference of 0.13%), and Immigrants from Japan (11.4%, a difference of 0.13%).
| Demographics | Rating | Rank | No Vehicles in Household |
| Immigrants | South America | 8.0 /100 | #222 | Tragic 11.3% |
| Uruguayans | 7.7 /100 | #223 | Tragic 11.3% |
| Immigrants | Hong Kong | 7.2 /100 | #224 | Tragic 11.3% |
| Immigrants | Sierra Leone | 6.4 /100 | #225 | Tragic 11.3% |
| Immigrants | Somalia | 5.4 /100 | #226 | Tragic 11.4% |
| Immigrants | Pakistan | 5.4 /100 | #227 | Tragic 11.4% |
| Immigrants | Romania | 5.3 /100 | #228 | Tragic 11.4% |
| Ugandans | 5.3 /100 | #229 | Tragic 11.4% |
| Immigrants | Norway | 5.1 /100 | #230 | Tragic 11.4% |
| Immigrants | Japan | 5.1 /100 | #231 | Tragic 11.4% |
| Immigrants | Turkey | 4.8 /100 | #232 | Tragic 11.5% |
| Houma | 4.7 /100 | #233 | Tragic 11.5% |
| Immigrants | Peru | 4.5 /100 | #234 | Tragic 11.5% |
| Kiowa | 4.0 /100 | #235 | Tragic 11.5% |
| Cree | 3.5 /100 | #236 | Tragic 11.6% |
Demographics Similar to South Americans by No Vehicles in Household
In terms of no vehicles in household, the demographic groups most similar to South Americans are Immigrants from Nepal (10.5%, a difference of 0.070%), German Russian (10.5%, a difference of 0.18%), Native/Alaskan (10.5%, a difference of 0.24%), Immigrants from Bulgaria (10.5%, a difference of 0.26%), and Immigrants from Colombia (10.5%, a difference of 0.30%).
| Demographics | Rating | Rank | No Vehicles in Household |
| Immigrants | Ethiopia | 48.0 /100 | #178 | Average 10.4% |
| Ethiopians | 45.8 /100 | #179 | Average 10.5% |
| Arabs | 45.3 /100 | #180 | Average 10.5% |
| Immigrants | Colombia | 44.1 /100 | #181 | Average 10.5% |
| Immigrants | Bulgaria | 43.8 /100 | #182 | Average 10.5% |
| Natives/Alaskans | 43.7 /100 | #183 | Average 10.5% |
| Immigrants | Nepal | 42.4 /100 | #184 | Average 10.5% |
| South Americans | 41.9 /100 | #185 | Average 10.5% |
| German Russians | 40.6 /100 | #186 | Average 10.5% |
| Immigrants | Poland | 38.4 /100 | #187 | Fair 10.6% |
| Immigrants | Armenia | 37.5 /100 | #188 | Fair 10.6% |
| Immigrants | Eritrea | 36.3 /100 | #189 | Fair 10.6% |
| Immigrants | North Macedonia | 34.6 /100 | #190 | Fair 10.6% |
| Immigrants | Northern Europe | 33.1 /100 | #191 | Fair 10.7% |
| Carpatho Rusyns | 32.1 /100 | #192 | Fair 10.7% |