Tsimshian vs South American Average Family Size
COMPARE
Tsimshian
South American
Average Family Size
Average Family Size Comparison
Tsimshian
South Americans
3.25
AVERAGE FAMILY SIZE
80.2/ 100
METRIC RATING
144th/ 347
METRIC RANK
3.27
AVERAGE FAMILY SIZE
95.1/ 100
METRIC RATING
114th/ 347
METRIC RANK
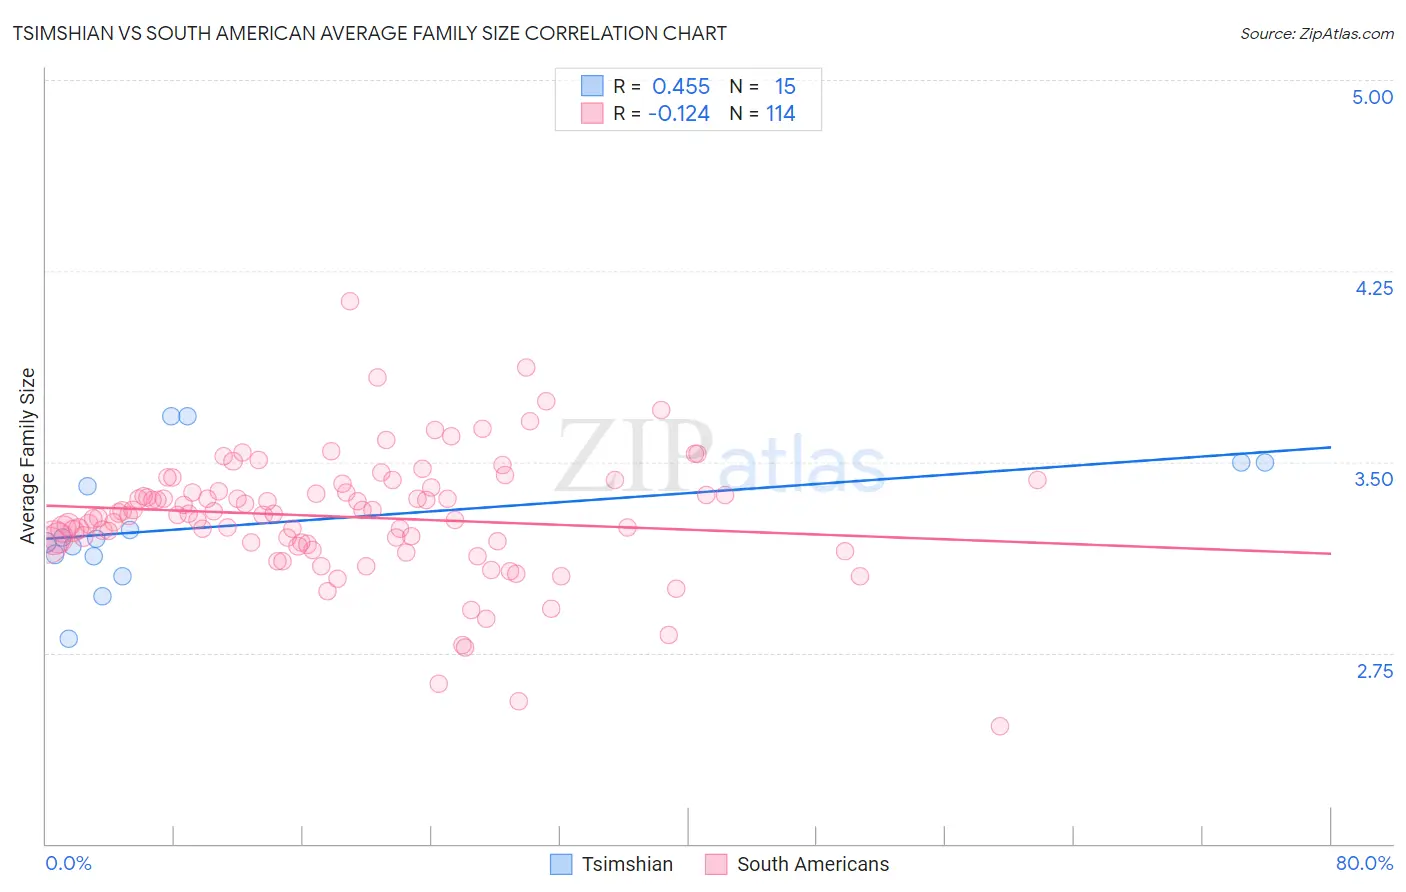
Tsimshian vs South American Average Family Size Correlation Chart
The statistical analysis conducted on geographies consisting of 15,626,544 people shows a moderate positive correlation between the proportion of Tsimshian and average family size in the United States with a correlation coefficient (R) of 0.455 and weighted average of 3.25. Similarly, the statistical analysis conducted on geographies consisting of 493,671,648 people shows a poor negative correlation between the proportion of South Americans and average family size in the United States with a correlation coefficient (R) of -0.124 and weighted average of 3.27, a difference of 0.71%.
Average Family Size Correlation Summary
| Measurement | Tsimshian | South American |
| Minimum | 2.80 | 2.46 |
| Maximum | 3.68 | 4.13 |
| Range | 0.88 | 1.67 |
| Mean | 3.26 | 3.28 |
| Median | 3.20 | 3.29 |
| Interquartile 25% (IQ1) | 3.13 | 3.18 |
| Interquartile 75% (IQ3) | 3.50 | 3.39 |
| Interquartile Range (IQR) | 0.37 | 0.20 |
| Standard Deviation (Sample) | 0.25 | 0.24 |
| Standard Deviation (Population) | 0.24 | 0.24 |
Similar Demographics by Average Family Size
Demographics Similar to Tsimshian by Average Family Size
In terms of average family size, the demographic groups most similar to Tsimshian are Bhutanese (3.25, a difference of 0.020%), Liberian (3.25, a difference of 0.030%), Immigrants from Ethiopia (3.25, a difference of 0.040%), Subsaharan African (3.25, a difference of 0.040%), and Venezuelan (3.25, a difference of 0.040%).
| Demographics | Rating | Rank | Average Family Size |
| Immigrants | Middle Africa | 82.4 /100 | #137 | Excellent 3.25 |
| Cubans | 81.8 /100 | #138 | Excellent 3.25 |
| Immigrants | Ethiopia | 81.6 /100 | #139 | Excellent 3.25 |
| Sub-Saharan Africans | 81.6 /100 | #140 | Excellent 3.25 |
| Venezuelans | 81.4 /100 | #141 | Excellent 3.25 |
| Liberians | 81.2 /100 | #142 | Excellent 3.25 |
| Bhutanese | 81.0 /100 | #143 | Excellent 3.25 |
| Tsimshian | 80.2 /100 | #144 | Excellent 3.25 |
| Armenians | 78.2 /100 | #145 | Good 3.25 |
| Immigrants | Africa | 77.9 /100 | #146 | Good 3.25 |
| Immigrants | Jordan | 75.7 /100 | #147 | Good 3.24 |
| Blackfeet | 75.0 /100 | #148 | Good 3.24 |
| Assyrians/Chaldeans/Syriacs | 73.8 /100 | #149 | Good 3.24 |
| Indians (Asian) | 73.6 /100 | #150 | Good 3.24 |
| Jordanians | 73.5 /100 | #151 | Good 3.24 |
Demographics Similar to South Americans by Average Family Size
In terms of average family size, the demographic groups most similar to South Americans are Immigrants from Liberia (3.27, a difference of 0.010%), Immigrants from South America (3.27, a difference of 0.010%), Kiowa (3.27, a difference of 0.030%), Immigrants from Panama (3.27, a difference of 0.050%), and Black/African American (3.27, a difference of 0.060%).
| Demographics | Rating | Rank | Average Family Size |
| Ghanaians | 98.0 /100 | #107 | Exceptional 3.29 |
| Asians | 97.0 /100 | #108 | Exceptional 3.28 |
| Puerto Ricans | 96.7 /100 | #109 | Exceptional 3.28 |
| Bahamians | 96.6 /100 | #110 | Exceptional 3.28 |
| Indonesians | 96.2 /100 | #111 | Exceptional 3.28 |
| Blacks/African Americans | 95.7 /100 | #112 | Exceptional 3.27 |
| Immigrants | Panama | 95.6 /100 | #113 | Exceptional 3.27 |
| South Americans | 95.1 /100 | #114 | Exceptional 3.27 |
| Immigrants | Liberia | 95.0 /100 | #115 | Exceptional 3.27 |
| Immigrants | South America | 95.0 /100 | #116 | Exceptional 3.27 |
| Kiowa | 94.8 /100 | #117 | Exceptional 3.27 |
| Immigrants | Asia | 94.0 /100 | #118 | Exceptional 3.27 |
| Immigrants | Indonesia | 93.7 /100 | #119 | Exceptional 3.27 |
| Immigrants | Bahamas | 93.6 /100 | #120 | Exceptional 3.27 |
| Immigrants | Thailand | 93.3 /100 | #121 | Exceptional 3.27 |