Spaniard vs South American Average Family Size
COMPARE
Spaniard
South American
Average Family Size
Average Family Size Comparison
Spaniards
South Americans
3.23
AVERAGE FAMILY SIZE
47.2/ 100
METRIC RATING
178th/ 347
METRIC RANK
3.27
AVERAGE FAMILY SIZE
95.1/ 100
METRIC RATING
114th/ 347
METRIC RANK
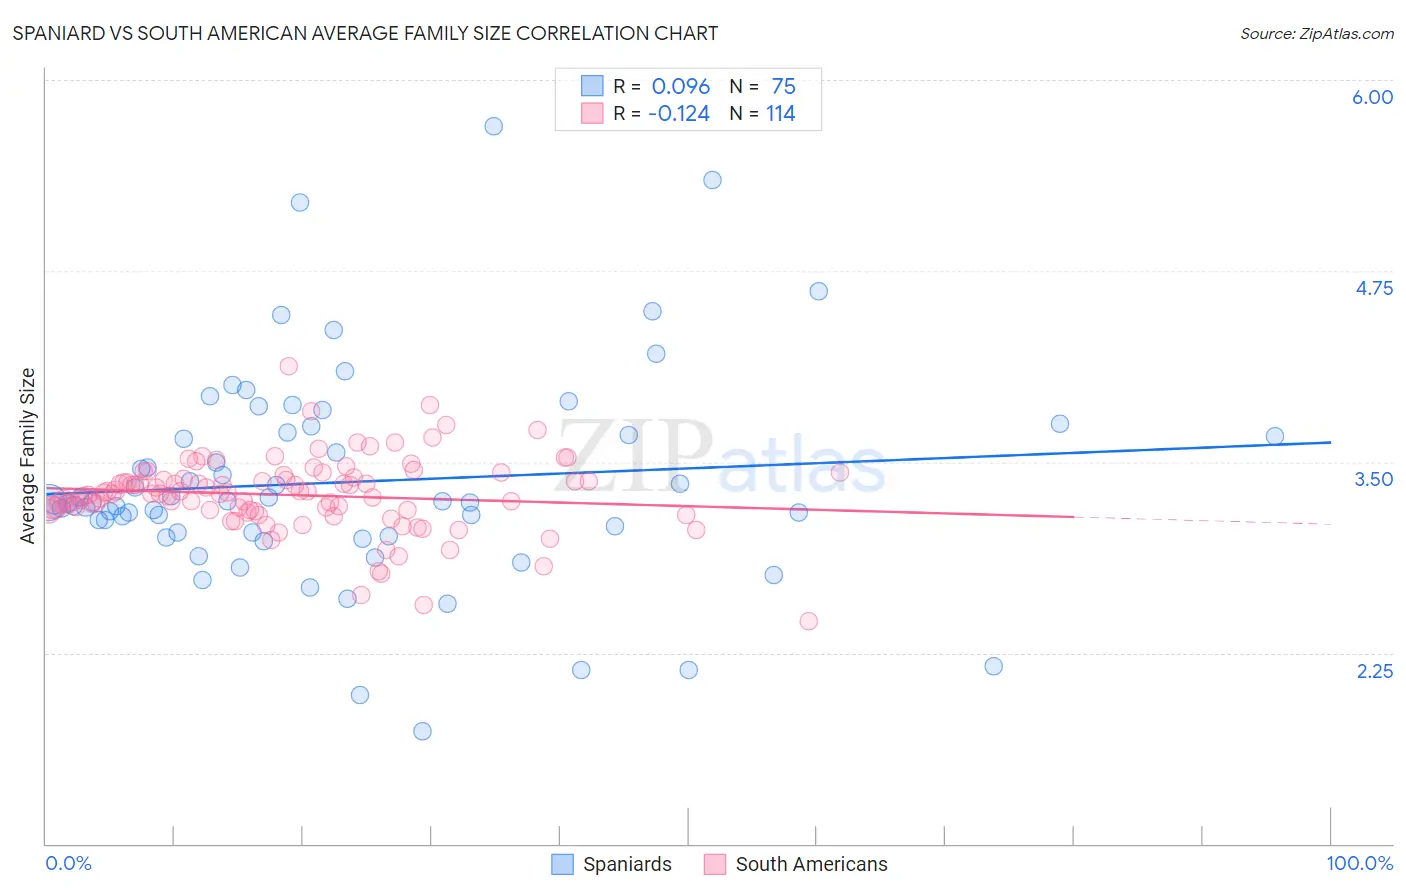
Spaniard vs South American Average Family Size Correlation Chart
The statistical analysis conducted on geographies consisting of 443,170,080 people shows a slight positive correlation between the proportion of Spaniards and average family size in the United States with a correlation coefficient (R) of 0.096 and weighted average of 3.23. Similarly, the statistical analysis conducted on geographies consisting of 493,671,648 people shows a poor negative correlation between the proportion of South Americans and average family size in the United States with a correlation coefficient (R) of -0.124 and weighted average of 3.27, a difference of 1.4%.
Average Family Size Correlation Summary
| Measurement | Spaniard | South American |
| Minimum | 1.74 | 2.46 |
| Maximum | 5.70 | 4.13 |
| Range | 3.96 | 1.67 |
| Mean | 3.37 | 3.28 |
| Median | 3.23 | 3.29 |
| Interquartile 25% (IQ1) | 3.04 | 3.18 |
| Interquartile 75% (IQ3) | 3.69 | 3.39 |
| Interquartile Range (IQR) | 0.66 | 0.20 |
| Standard Deviation (Sample) | 0.70 | 0.24 |
| Standard Deviation (Population) | 0.69 | 0.24 |
Similar Demographics by Average Family Size
Demographics Similar to Spaniards by Average Family Size
In terms of average family size, the demographic groups most similar to Spaniards are Argentinean (3.23, a difference of 0.0%), Immigrants from Korea (3.23, a difference of 0.010%), Palestinian (3.23, a difference of 0.010%), Israeli (3.23, a difference of 0.030%), and Spanish (3.23, a difference of 0.040%).
| Demographics | Rating | Rank | Average Family Size |
| Chileans | 53.2 /100 | #171 | Average 3.23 |
| Immigrants | Congo | 52.7 /100 | #172 | Average 3.23 |
| Immigrants | Uruguay | 52.0 /100 | #173 | Average 3.23 |
| Immigrants | South Central Asia | 50.0 /100 | #174 | Average 3.23 |
| Immigrants | China | 49.9 /100 | #175 | Average 3.23 |
| Israelis | 48.7 /100 | #176 | Average 3.23 |
| Argentineans | 47.4 /100 | #177 | Average 3.23 |
| Spaniards | 47.2 /100 | #178 | Average 3.23 |
| Immigrants | Korea | 46.9 /100 | #179 | Average 3.23 |
| Palestinians | 46.6 /100 | #180 | Average 3.23 |
| Spanish | 44.8 /100 | #181 | Average 3.23 |
| Moroccans | 44.2 /100 | #182 | Average 3.22 |
| Immigrants | Northern Africa | 41.7 /100 | #183 | Average 3.22 |
| Immigrants | Eastern Asia | 40.8 /100 | #184 | Average 3.22 |
| Immigrants | Sri Lanka | 39.8 /100 | #185 | Fair 3.22 |
Demographics Similar to South Americans by Average Family Size
In terms of average family size, the demographic groups most similar to South Americans are Immigrants from Liberia (3.27, a difference of 0.010%), Immigrants from South America (3.27, a difference of 0.010%), Kiowa (3.27, a difference of 0.030%), Immigrants from Panama (3.27, a difference of 0.050%), and Black/African American (3.27, a difference of 0.060%).
| Demographics | Rating | Rank | Average Family Size |
| Ghanaians | 98.0 /100 | #107 | Exceptional 3.29 |
| Asians | 97.0 /100 | #108 | Exceptional 3.28 |
| Puerto Ricans | 96.7 /100 | #109 | Exceptional 3.28 |
| Bahamians | 96.6 /100 | #110 | Exceptional 3.28 |
| Indonesians | 96.2 /100 | #111 | Exceptional 3.28 |
| Blacks/African Americans | 95.7 /100 | #112 | Exceptional 3.27 |
| Immigrants | Panama | 95.6 /100 | #113 | Exceptional 3.27 |
| South Americans | 95.1 /100 | #114 | Exceptional 3.27 |
| Immigrants | Liberia | 95.0 /100 | #115 | Exceptional 3.27 |
| Immigrants | South America | 95.0 /100 | #116 | Exceptional 3.27 |
| Kiowa | 94.8 /100 | #117 | Exceptional 3.27 |
| Immigrants | Asia | 94.0 /100 | #118 | Exceptional 3.27 |
| Immigrants | Indonesia | 93.7 /100 | #119 | Exceptional 3.27 |
| Immigrants | Bahamas | 93.6 /100 | #120 | Exceptional 3.27 |
| Immigrants | Thailand | 93.3 /100 | #121 | Exceptional 3.27 |