Immigrants from Croatia vs British West Indian Average Family Size
COMPARE
Immigrants from Croatia
British West Indian
Average Family Size
Average Family Size Comparison
Immigrants from Croatia
British West Indians
3.14
AVERAGE FAMILY SIZE
0.2/ 100
METRIC RATING
294th/ 347
METRIC RANK
3.32
AVERAGE FAMILY SIZE
99.8/ 100
METRIC RATING
79th/ 347
METRIC RANK
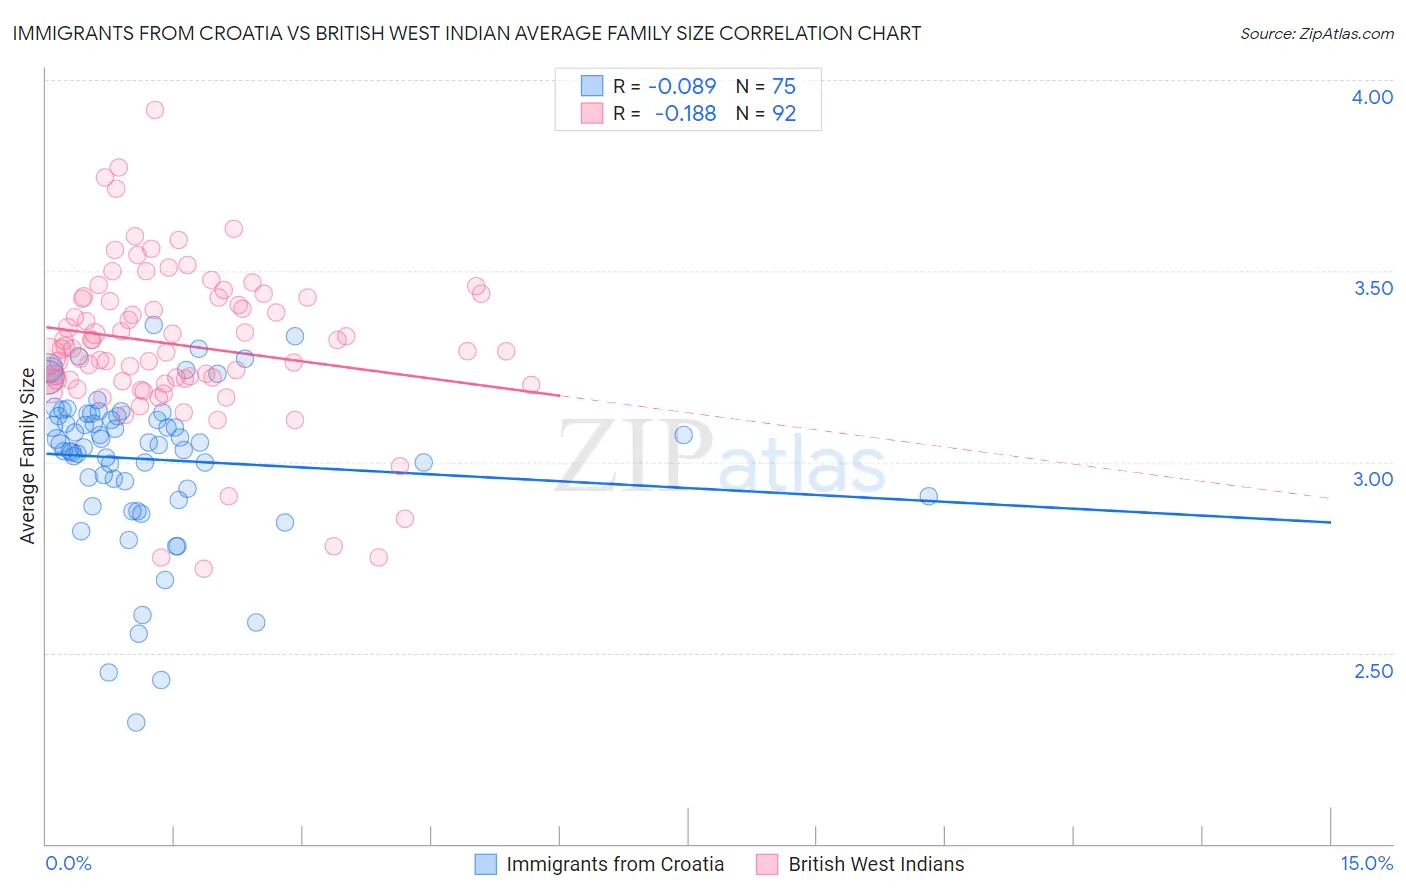
Immigrants from Croatia vs British West Indian Average Family Size Correlation Chart
The statistical analysis conducted on geographies consisting of 132,563,359 people shows a slight negative correlation between the proportion of Immigrants from Croatia and average family size in the United States with a correlation coefficient (R) of -0.089 and weighted average of 3.14. Similarly, the statistical analysis conducted on geographies consisting of 152,638,321 people shows a poor negative correlation between the proportion of British West Indians and average family size in the United States with a correlation coefficient (R) of -0.188 and weighted average of 3.32, a difference of 5.8%.
Average Family Size Correlation Summary
| Measurement | Immigrants from Croatia | British West Indian |
| Minimum | 2.32 | 2.72 |
| Maximum | 3.36 | 3.92 |
| Range | 1.04 | 1.20 |
| Mean | 3.01 | 3.31 |
| Median | 3.05 | 3.30 |
| Interquartile 25% (IQ1) | 2.93 | 3.21 |
| Interquartile 75% (IQ3) | 3.13 | 3.43 |
| Interquartile Range (IQR) | 0.20 | 0.22 |
| Standard Deviation (Sample) | 0.20 | 0.21 |
| Standard Deviation (Population) | 0.20 | 0.21 |
Similar Demographics by Average Family Size
Demographics Similar to Immigrants from Croatia by Average Family Size
In terms of average family size, the demographic groups most similar to Immigrants from Croatia are Austrian (3.14, a difference of 0.010%), Ukrainian (3.14, a difference of 0.010%), Immigrants from Western Europe (3.14, a difference of 0.010%), Colville (3.14, a difference of 0.010%), and Scandinavian (3.14, a difference of 0.020%).
| Demographics | Rating | Rank | Average Family Size |
| Greeks | 0.3 /100 | #287 | Tragic 3.14 |
| Immigrants | Czechoslovakia | 0.3 /100 | #288 | Tragic 3.14 |
| Immigrants | Norway | 0.3 /100 | #289 | Tragic 3.14 |
| Cypriots | 0.3 /100 | #290 | Tragic 3.14 |
| Alsatians | 0.2 /100 | #291 | Tragic 3.14 |
| Europeans | 0.2 /100 | #292 | Tragic 3.14 |
| Scandinavians | 0.2 /100 | #293 | Tragic 3.14 |
| Immigrants | Croatia | 0.2 /100 | #294 | Tragic 3.14 |
| Austrians | 0.2 /100 | #295 | Tragic 3.14 |
| Ukrainians | 0.2 /100 | #296 | Tragic 3.14 |
| Immigrants | Western Europe | 0.2 /100 | #297 | Tragic 3.14 |
| Colville | 0.2 /100 | #298 | Tragic 3.14 |
| Canadians | 0.2 /100 | #299 | Tragic 3.14 |
| Immigrants | Sweden | 0.2 /100 | #300 | Tragic 3.14 |
| Macedonians | 0.2 /100 | #301 | Tragic 3.13 |
Demographics Similar to British West Indians by Average Family Size
In terms of average family size, the demographic groups most similar to British West Indians are Immigrants from Micronesia (3.32, a difference of 0.010%), Lumbee (3.32, a difference of 0.020%), Immigrants from Ecuador (3.32, a difference of 0.050%), Trinidadian and Tobagonian (3.32, a difference of 0.060%), and Immigrants from Dominica (3.32, a difference of 0.060%).
| Demographics | Rating | Rank | Average Family Size |
| Immigrants | Caribbean | 99.9 /100 | #72 | Exceptional 3.33 |
| Yaqui | 99.9 /100 | #73 | Exceptional 3.32 |
| Immigrants | Sierra Leone | 99.9 /100 | #74 | Exceptional 3.32 |
| Immigrants | Barbados | 99.8 /100 | #75 | Exceptional 3.32 |
| Trinidadians and Tobagonians | 99.8 /100 | #76 | Exceptional 3.32 |
| Immigrants | Ecuador | 99.8 /100 | #77 | Exceptional 3.32 |
| Immigrants | Micronesia | 99.8 /100 | #78 | Exceptional 3.32 |
| British West Indians | 99.8 /100 | #79 | Exceptional 3.32 |
| Lumbee | 99.8 /100 | #80 | Exceptional 3.32 |
| Immigrants | Dominica | 99.8 /100 | #81 | Exceptional 3.32 |
| Ecuadorians | 99.8 /100 | #82 | Exceptional 3.32 |
| Immigrants | Afghanistan | 99.8 /100 | #83 | Exceptional 3.32 |
| Immigrants | Nigeria | 99.7 /100 | #84 | Exceptional 3.32 |
| Afghans | 99.7 /100 | #85 | Exceptional 3.31 |
| Jamaicans | 99.7 /100 | #86 | Exceptional 3.31 |