Immigrants from Nepal vs British West Indian Average Family Size
COMPARE
Immigrants from Nepal
British West Indian
Average Family Size
Average Family Size Comparison
Immigrants from Nepal
British West Indians
3.21
AVERAGE FAMILY SIZE
18.1/ 100
METRIC RATING
203rd/ 347
METRIC RANK
3.32
AVERAGE FAMILY SIZE
99.8/ 100
METRIC RATING
79th/ 347
METRIC RANK
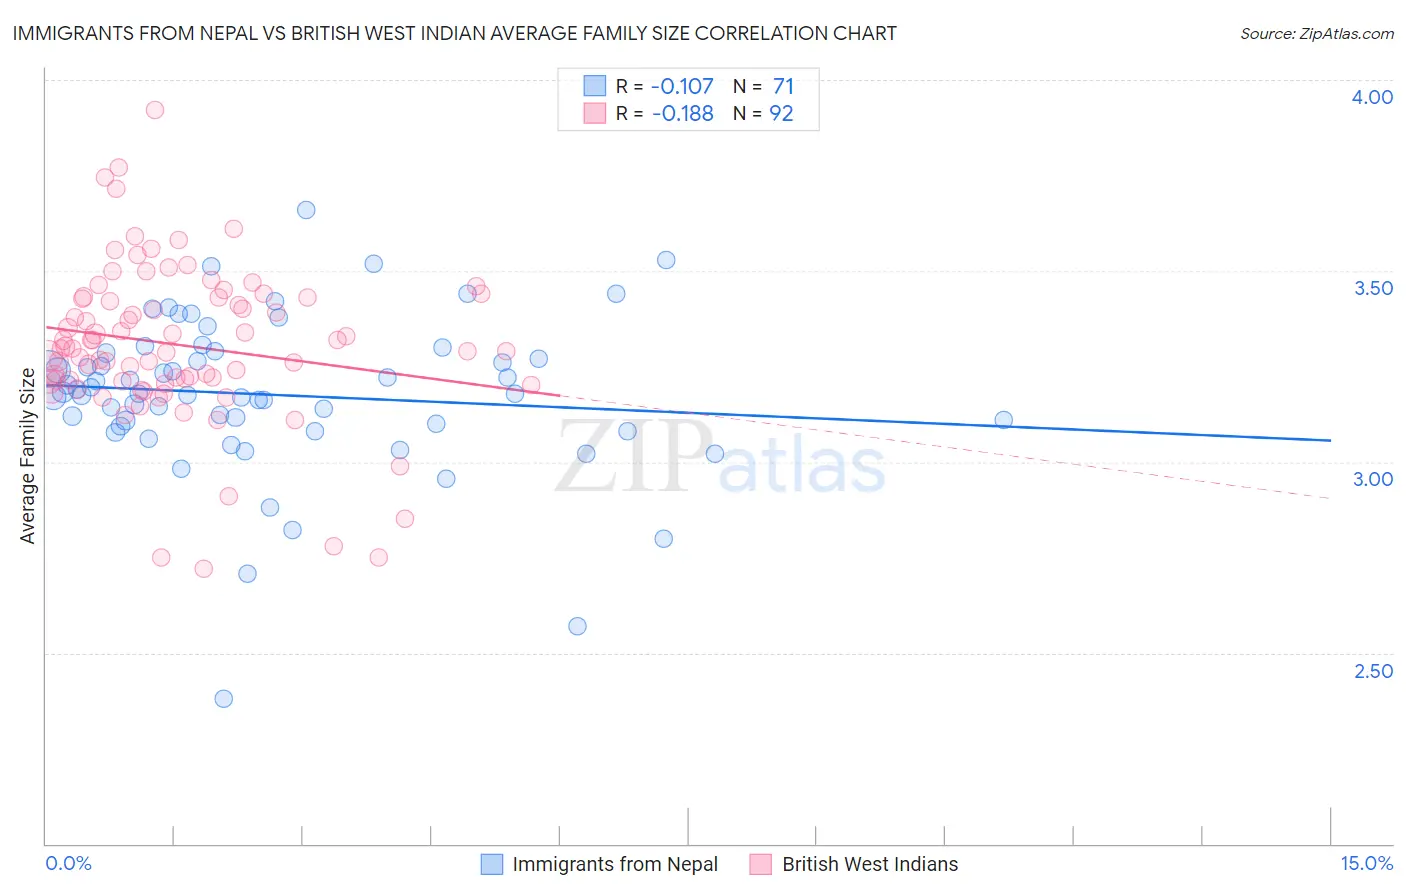
Immigrants from Nepal vs British West Indian Average Family Size Correlation Chart
The statistical analysis conducted on geographies consisting of 186,665,841 people shows a poor negative correlation between the proportion of Immigrants from Nepal and average family size in the United States with a correlation coefficient (R) of -0.107 and weighted average of 3.21. Similarly, the statistical analysis conducted on geographies consisting of 152,638,321 people shows a poor negative correlation between the proportion of British West Indians and average family size in the United States with a correlation coefficient (R) of -0.188 and weighted average of 3.32, a difference of 3.6%.
Average Family Size Correlation Summary
| Measurement | Immigrants from Nepal | British West Indian |
| Minimum | 2.38 | 2.72 |
| Maximum | 3.66 | 3.92 |
| Range | 1.28 | 1.20 |
| Mean | 3.18 | 3.31 |
| Median | 3.18 | 3.30 |
| Interquartile 25% (IQ1) | 3.09 | 3.21 |
| Interquartile 75% (IQ3) | 3.29 | 3.43 |
| Interquartile Range (IQR) | 0.19 | 0.22 |
| Standard Deviation (Sample) | 0.21 | 0.21 |
| Standard Deviation (Population) | 0.21 | 0.21 |
Similar Demographics by Average Family Size
Demographics Similar to Immigrants from Nepal by Average Family Size
In terms of average family size, the demographic groups most similar to Immigrants from Nepal are Immigrants from Morocco (3.21, a difference of 0.010%), Immigrants from India (3.21, a difference of 0.010%), Immigrants from Kenya (3.21, a difference of 0.030%), Immigrants from Poland (3.20, a difference of 0.050%), and Paraguayan (3.20, a difference of 0.060%).
| Demographics | Rating | Rank | Average Family Size |
| Senegalese | 28.2 /100 | #196 | Fair 3.21 |
| Kenyans | 28.0 /100 | #197 | Fair 3.21 |
| Immigrants | Azores | 21.7 /100 | #198 | Fair 3.21 |
| Hmong | 20.7 /100 | #199 | Fair 3.21 |
| Immigrants | Kenya | 19.2 /100 | #200 | Poor 3.21 |
| Immigrants | Morocco | 18.5 /100 | #201 | Poor 3.21 |
| Immigrants | India | 18.5 /100 | #202 | Poor 3.21 |
| Immigrants | Nepal | 18.1 /100 | #203 | Poor 3.21 |
| Immigrants | Poland | 16.6 /100 | #204 | Poor 3.20 |
| Paraguayans | 16.3 /100 | #205 | Poor 3.20 |
| Immigrants | Cabo Verde | 16.0 /100 | #206 | Poor 3.20 |
| Filipinos | 13.6 /100 | #207 | Poor 3.20 |
| Chippewa | 13.3 /100 | #208 | Poor 3.20 |
| Sudanese | 13.3 /100 | #209 | Poor 3.20 |
| Zimbabweans | 12.6 /100 | #210 | Poor 3.20 |
Demographics Similar to British West Indians by Average Family Size
In terms of average family size, the demographic groups most similar to British West Indians are Immigrants from Micronesia (3.32, a difference of 0.010%), Lumbee (3.32, a difference of 0.020%), Immigrants from Ecuador (3.32, a difference of 0.050%), Trinidadian and Tobagonian (3.32, a difference of 0.060%), and Immigrants from Dominica (3.32, a difference of 0.060%).
| Demographics | Rating | Rank | Average Family Size |
| Immigrants | Caribbean | 99.9 /100 | #72 | Exceptional 3.33 |
| Yaqui | 99.9 /100 | #73 | Exceptional 3.32 |
| Immigrants | Sierra Leone | 99.9 /100 | #74 | Exceptional 3.32 |
| Immigrants | Barbados | 99.8 /100 | #75 | Exceptional 3.32 |
| Trinidadians and Tobagonians | 99.8 /100 | #76 | Exceptional 3.32 |
| Immigrants | Ecuador | 99.8 /100 | #77 | Exceptional 3.32 |
| Immigrants | Micronesia | 99.8 /100 | #78 | Exceptional 3.32 |
| British West Indians | 99.8 /100 | #79 | Exceptional 3.32 |
| Lumbee | 99.8 /100 | #80 | Exceptional 3.32 |
| Immigrants | Dominica | 99.8 /100 | #81 | Exceptional 3.32 |
| Ecuadorians | 99.8 /100 | #82 | Exceptional 3.32 |
| Immigrants | Afghanistan | 99.8 /100 | #83 | Exceptional 3.32 |
| Immigrants | Nigeria | 99.7 /100 | #84 | Exceptional 3.32 |
| Afghans | 99.7 /100 | #85 | Exceptional 3.31 |
| Jamaicans | 99.7 /100 | #86 | Exceptional 3.31 |