Portuguese vs British West Indian Average Family Size
COMPARE
Portuguese
British West Indian
Average Family Size
Average Family Size Comparison
Portuguese
British West Indians
3.19
AVERAGE FAMILY SIZE
6.0/ 100
METRIC RATING
227th/ 347
METRIC RANK
3.32
AVERAGE FAMILY SIZE
99.8/ 100
METRIC RATING
79th/ 347
METRIC RANK
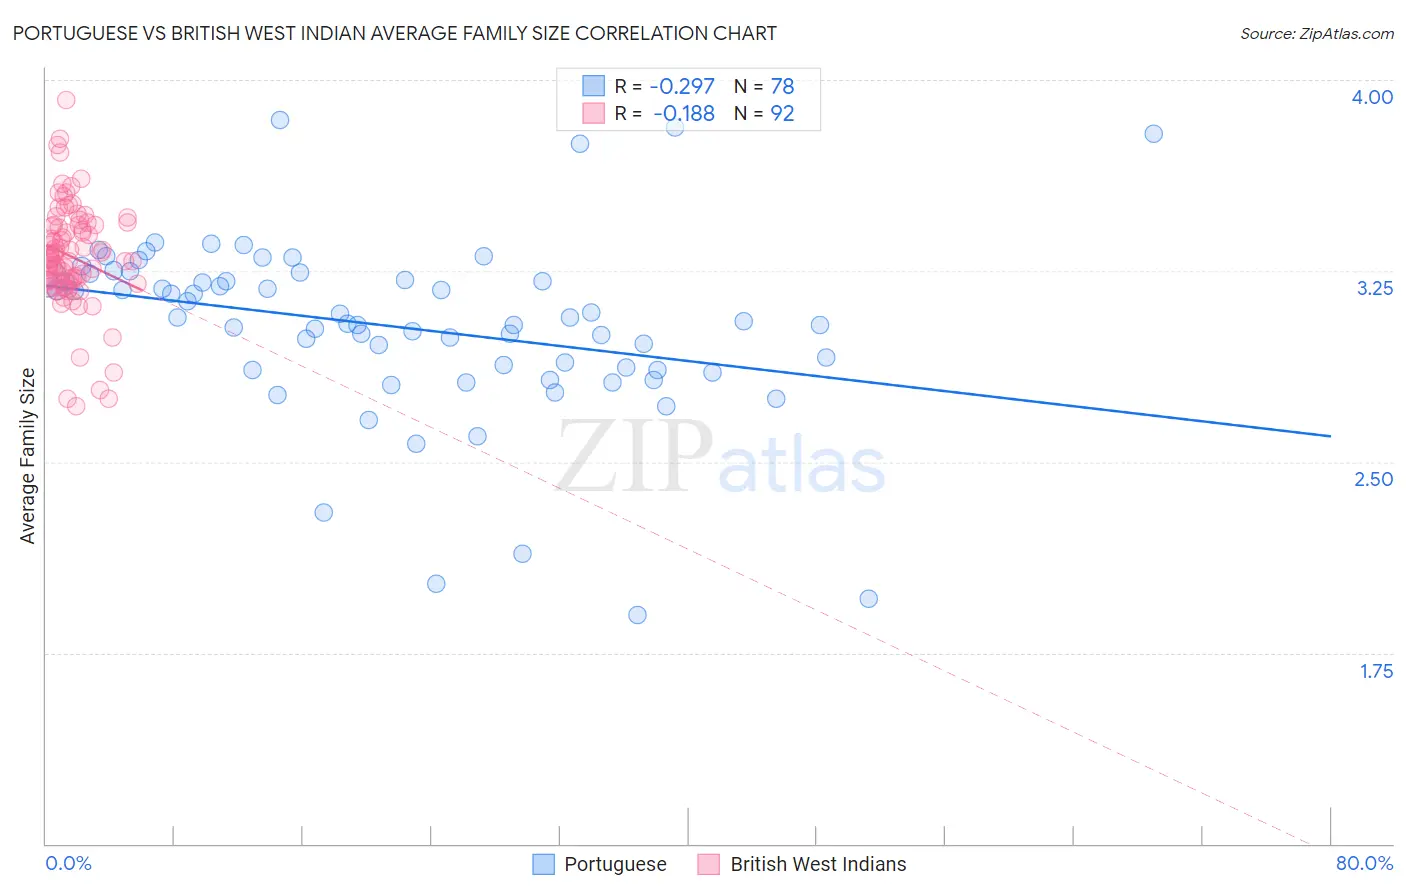
Portuguese vs British West Indian Average Family Size Correlation Chart
The statistical analysis conducted on geographies consisting of 449,985,413 people shows a weak negative correlation between the proportion of Portuguese and average family size in the United States with a correlation coefficient (R) of -0.297 and weighted average of 3.19. Similarly, the statistical analysis conducted on geographies consisting of 152,638,321 people shows a poor negative correlation between the proportion of British West Indians and average family size in the United States with a correlation coefficient (R) of -0.188 and weighted average of 3.32, a difference of 4.2%.
Average Family Size Correlation Summary
| Measurement | Portuguese | British West Indian |
| Minimum | 1.90 | 2.72 |
| Maximum | 3.84 | 3.92 |
| Range | 1.94 | 1.20 |
| Mean | 3.03 | 3.31 |
| Median | 3.06 | 3.30 |
| Interquartile 25% (IQ1) | 2.86 | 3.21 |
| Interquartile 75% (IQ3) | 3.22 | 3.43 |
| Interquartile Range (IQR) | 0.36 | 0.22 |
| Standard Deviation (Sample) | 0.36 | 0.21 |
| Standard Deviation (Population) | 0.36 | 0.21 |
Similar Demographics by Average Family Size
Demographics Similar to Portuguese by Average Family Size
In terms of average family size, the demographic groups most similar to Portuguese are Chickasaw (3.19, a difference of 0.0%), Cree (3.19, a difference of 0.020%), Nonimmigrants (3.19, a difference of 0.020%), Syrian (3.19, a difference of 0.040%), and Immigrants from Italy (3.19, a difference of 0.060%).
| Demographics | Rating | Rank | Average Family Size |
| Lebanese | 9.1 /100 | #220 | Tragic 3.19 |
| Immigrants | Ukraine | 7.2 /100 | #221 | Tragic 3.19 |
| Immigrants | Kuwait | 7.2 /100 | #222 | Tragic 3.19 |
| Immigrants | Zimbabwe | 7.1 /100 | #223 | Tragic 3.19 |
| Syrians | 6.5 /100 | #224 | Tragic 3.19 |
| Cree | 6.2 /100 | #225 | Tragic 3.19 |
| Chickasaw | 6.0 /100 | #226 | Tragic 3.19 |
| Portuguese | 6.0 /100 | #227 | Tragic 3.19 |
| Immigrants | Nonimmigrants | 5.7 /100 | #228 | Tragic 3.19 |
| Immigrants | Italy | 5.3 /100 | #229 | Tragic 3.19 |
| Icelanders | 5.2 /100 | #230 | Tragic 3.19 |
| Basques | 5.2 /100 | #231 | Tragic 3.19 |
| Cherokee | 4.7 /100 | #232 | Tragic 3.18 |
| Brazilians | 4.5 /100 | #233 | Tragic 3.18 |
| Iranians | 4.5 /100 | #234 | Tragic 3.18 |
Demographics Similar to British West Indians by Average Family Size
In terms of average family size, the demographic groups most similar to British West Indians are Immigrants from Micronesia (3.32, a difference of 0.010%), Lumbee (3.32, a difference of 0.020%), Immigrants from Ecuador (3.32, a difference of 0.050%), Trinidadian and Tobagonian (3.32, a difference of 0.060%), and Immigrants from Dominica (3.32, a difference of 0.060%).
| Demographics | Rating | Rank | Average Family Size |
| Immigrants | Caribbean | 99.9 /100 | #72 | Exceptional 3.33 |
| Yaqui | 99.9 /100 | #73 | Exceptional 3.32 |
| Immigrants | Sierra Leone | 99.9 /100 | #74 | Exceptional 3.32 |
| Immigrants | Barbados | 99.8 /100 | #75 | Exceptional 3.32 |
| Trinidadians and Tobagonians | 99.8 /100 | #76 | Exceptional 3.32 |
| Immigrants | Ecuador | 99.8 /100 | #77 | Exceptional 3.32 |
| Immigrants | Micronesia | 99.8 /100 | #78 | Exceptional 3.32 |
| British West Indians | 99.8 /100 | #79 | Exceptional 3.32 |
| Lumbee | 99.8 /100 | #80 | Exceptional 3.32 |
| Immigrants | Dominica | 99.8 /100 | #81 | Exceptional 3.32 |
| Ecuadorians | 99.8 /100 | #82 | Exceptional 3.32 |
| Immigrants | Afghanistan | 99.8 /100 | #83 | Exceptional 3.32 |
| Immigrants | Nigeria | 99.7 /100 | #84 | Exceptional 3.32 |
| Afghans | 99.7 /100 | #85 | Exceptional 3.31 |
| Jamaicans | 99.7 /100 | #86 | Exceptional 3.31 |