Ugandan vs British West Indian Bachelor's Degree
COMPARE
Ugandan
British West Indian
Bachelor's Degree
Bachelor's Degree Comparison
Ugandans
British West Indians
40.8%
BACHELOR'S DEGREE
96.3/ 100
METRIC RATING
112th/ 347
METRIC RANK
34.5%
BACHELOR'S DEGREE
2.5/ 100
METRIC RATING
239th/ 347
METRIC RANK
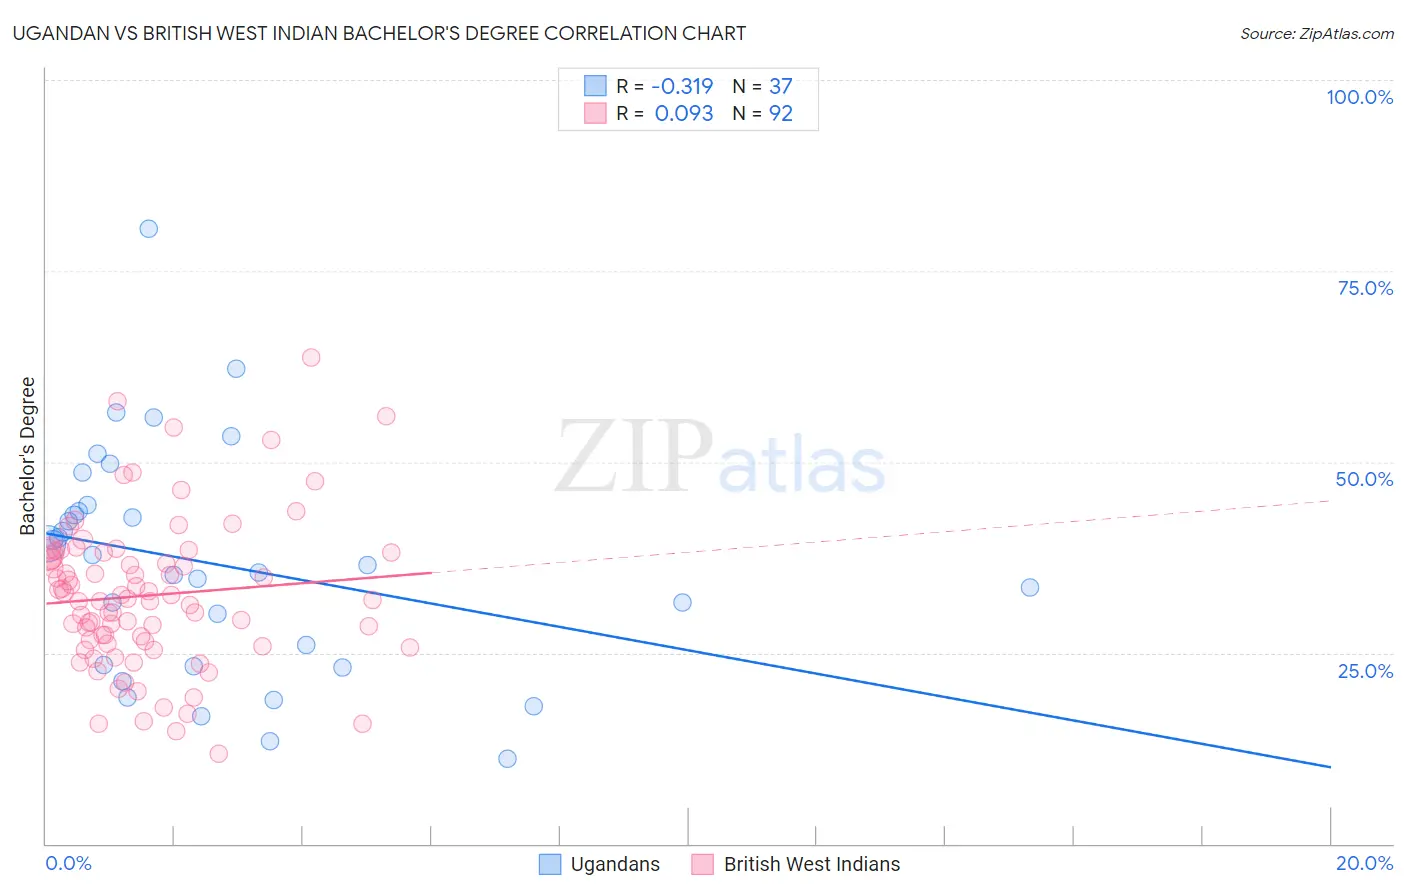
Ugandan vs British West Indian Bachelor's Degree Correlation Chart
The statistical analysis conducted on geographies consisting of 94,016,399 people shows a mild negative correlation between the proportion of Ugandans and percentage of population with at least bachelor's degree education in the United States with a correlation coefficient (R) of -0.319 and weighted average of 40.8%. Similarly, the statistical analysis conducted on geographies consisting of 152,683,655 people shows a slight positive correlation between the proportion of British West Indians and percentage of population with at least bachelor's degree education in the United States with a correlation coefficient (R) of 0.093 and weighted average of 34.5%, a difference of 18.5%.
Bachelor's Degree Correlation Summary
| Measurement | Ugandan | British West Indian |
| Minimum | 11.1% | 11.8% |
| Maximum | 80.5% | 63.7% |
| Range | 69.4% | 51.9% |
| Mean | 36.6% | 32.5% |
| Median | 36.6% | 32.0% |
| Interquartile 25% (IQ1) | 23.3% | 26.4% |
| Interquartile 75% (IQ3) | 43.9% | 38.0% |
| Interquartile Range (IQR) | 20.6% | 11.6% |
| Standard Deviation (Sample) | 14.9% | 9.8% |
| Standard Deviation (Population) | 14.7% | 9.7% |
Similar Demographics by Bachelor's Degree
Demographics Similar to Ugandans by Bachelor's Degree
In terms of bachelor's degree, the demographic groups most similar to Ugandans are Brazilian (40.8%, a difference of 0.040%), Immigrants from Chile (40.8%, a difference of 0.050%), Afghan (40.8%, a difference of 0.070%), Albanian (40.9%, a difference of 0.090%), and Arab (40.9%, a difference of 0.17%).
| Demographics | Rating | Rank | Bachelor's Degree |
| Syrians | 97.4 /100 | #105 | Exceptional 41.1% |
| Alsatians | 97.0 /100 | #106 | Exceptional 41.0% |
| Northern Europeans | 96.8 /100 | #107 | Exceptional 41.0% |
| Ukrainians | 96.6 /100 | #108 | Exceptional 40.9% |
| Arabs | 96.6 /100 | #109 | Exceptional 40.9% |
| Albanians | 96.5 /100 | #110 | Exceptional 40.9% |
| Immigrants | Chile | 96.4 /100 | #111 | Exceptional 40.8% |
| Ugandans | 96.3 /100 | #112 | Exceptional 40.8% |
| Brazilians | 96.3 /100 | #113 | Exceptional 40.8% |
| Afghans | 96.2 /100 | #114 | Exceptional 40.8% |
| Palestinians | 95.8 /100 | #115 | Exceptional 40.7% |
| Immigrants | Uganda | 95.7 /100 | #116 | Exceptional 40.7% |
| Austrians | 95.5 /100 | #117 | Exceptional 40.6% |
| Croatians | 95.5 /100 | #118 | Exceptional 40.6% |
| Immigrants | Syria | 94.9 /100 | #119 | Exceptional 40.5% |
Demographics Similar to British West Indians by Bachelor's Degree
In terms of bachelor's degree, the demographic groups most similar to British West Indians are Guyanese (34.5%, a difference of 0.020%), Tlingit-Haida (34.6%, a difference of 0.30%), Liberian (34.6%, a difference of 0.34%), Immigrants from West Indies (34.6%, a difference of 0.45%), and Guamanian/Chamorro (34.6%, a difference of 0.54%).
| Demographics | Rating | Rank | Bachelor's Degree |
| Hmong | 3.4 /100 | #232 | Tragic 34.8% |
| Immigrants | Ecuador | 3.3 /100 | #233 | Tragic 34.7% |
| Guamanians/Chamorros | 3.0 /100 | #234 | Tragic 34.6% |
| Immigrants | West Indies | 2.9 /100 | #235 | Tragic 34.6% |
| Liberians | 2.8 /100 | #236 | Tragic 34.6% |
| Tlingit-Haida | 2.8 /100 | #237 | Tragic 34.6% |
| Guyanese | 2.5 /100 | #238 | Tragic 34.5% |
| British West Indians | 2.5 /100 | #239 | Tragic 34.5% |
| Tongans | 2.0 /100 | #240 | Tragic 34.3% |
| Immigrants | Cambodia | 1.9 /100 | #241 | Tragic 34.2% |
| Immigrants | Nonimmigrants | 1.8 /100 | #242 | Tragic 34.2% |
| Immigrants | Guyana | 1.4 /100 | #243 | Tragic 33.9% |
| Delaware | 1.2 /100 | #244 | Tragic 33.8% |
| Immigrants | Fiji | 1.2 /100 | #245 | Tragic 33.7% |
| Jamaicans | 1.0 /100 | #246 | Tragic 33.6% |