Turkish vs Australian Average Family Size
COMPARE
Turkish
Australian
Average Family Size
Average Family Size Comparison
Turks
Australians
3.16
AVERAGE FAMILY SIZE
1.3/ 100
METRIC RATING
258th/ 347
METRIC RANK
3.13
AVERAGE FAMILY SIZE
0.1/ 100
METRIC RATING
305th/ 347
METRIC RANK
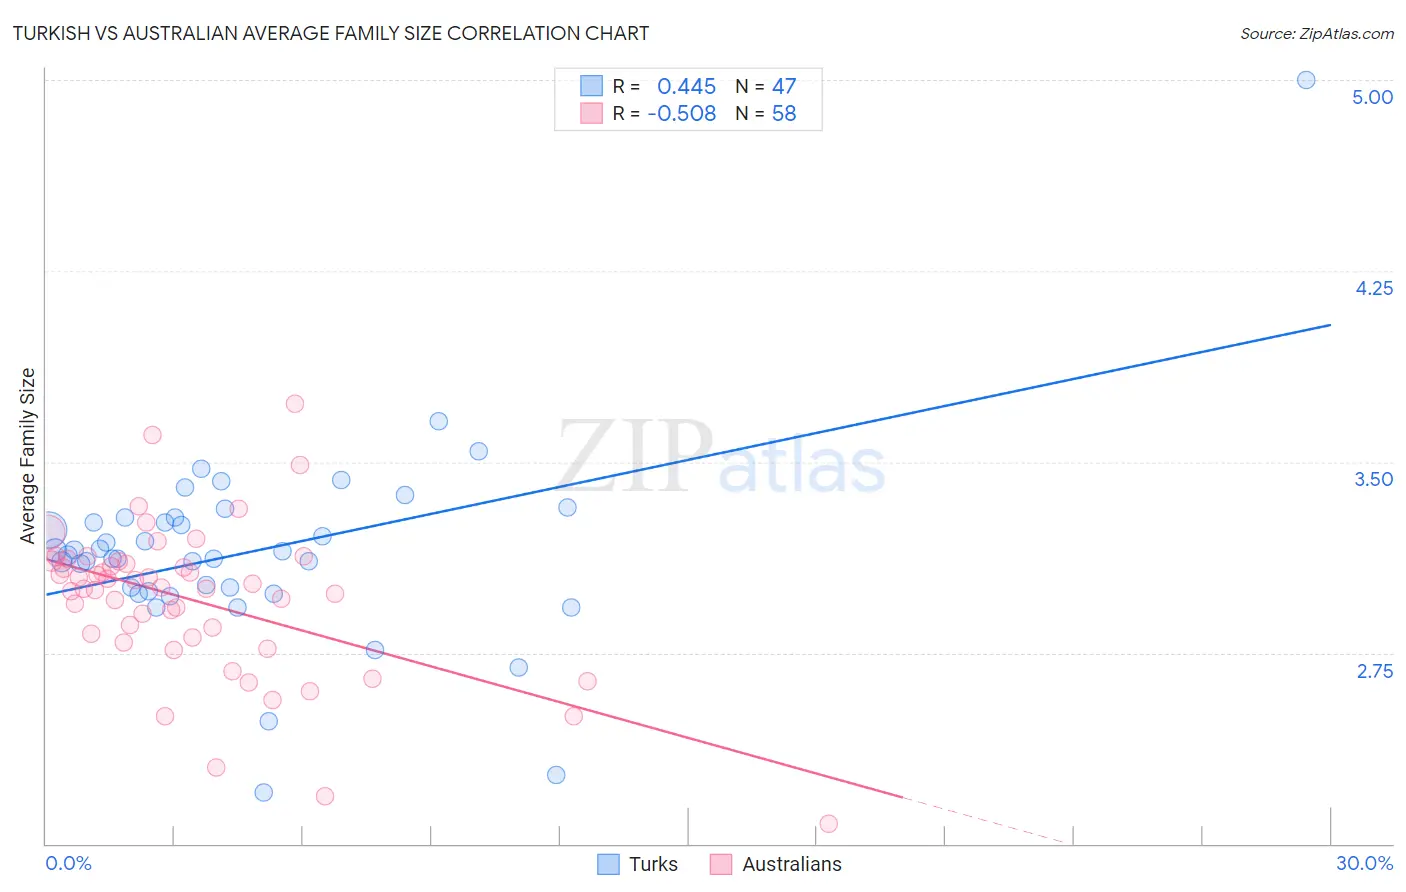
Turkish vs Australian Average Family Size Correlation Chart
The statistical analysis conducted on geographies consisting of 271,710,663 people shows a moderate positive correlation between the proportion of Turks and average family size in the United States with a correlation coefficient (R) of 0.445 and weighted average of 3.16. Similarly, the statistical analysis conducted on geographies consisting of 224,034,601 people shows a substantial negative correlation between the proportion of Australians and average family size in the United States with a correlation coefficient (R) of -0.508 and weighted average of 3.13, a difference of 1.0%.
Average Family Size Correlation Summary
| Measurement | Turkish | Australian |
| Minimum | 2.20 | 2.08 |
| Maximum | 5.00 | 3.73 |
| Range | 2.80 | 1.65 |
| Mean | 3.15 | 2.96 |
| Median | 3.13 | 3.00 |
| Interquartile 25% (IQ1) | 2.99 | 2.81 |
| Interquartile 75% (IQ3) | 3.28 | 3.11 |
| Interquartile Range (IQR) | 0.29 | 0.30 |
| Standard Deviation (Sample) | 0.39 | 0.30 |
| Standard Deviation (Population) | 0.39 | 0.30 |
Similar Demographics by Average Family Size
Demographics Similar to Turks by Average Family Size
In terms of average family size, the demographic groups most similar to Turks are Potawatomi (3.16, a difference of 0.0%), Immigrants from Albania (3.16, a difference of 0.010%), Immigrants from North Macedonia (3.16, a difference of 0.010%), Immigrants from Russia (3.16, a difference of 0.020%), and Albanian (3.17, a difference of 0.050%).
| Demographics | Rating | Rank | Average Family Size |
| Immigrants | Spain | 1.8 /100 | #251 | Tragic 3.17 |
| Immigrants | Saudi Arabia | 1.7 /100 | #252 | Tragic 3.17 |
| South Africans | 1.7 /100 | #253 | Tragic 3.17 |
| Immigrants | Hungary | 1.7 /100 | #254 | Tragic 3.17 |
| Cape Verdeans | 1.6 /100 | #255 | Tragic 3.17 |
| Immigrants | Kazakhstan | 1.5 /100 | #256 | Tragic 3.17 |
| Albanians | 1.5 /100 | #257 | Tragic 3.17 |
| Turks | 1.3 /100 | #258 | Tragic 3.16 |
| Potawatomi | 1.3 /100 | #259 | Tragic 3.16 |
| Immigrants | Albania | 1.3 /100 | #260 | Tragic 3.16 |
| Immigrants | North Macedonia | 1.3 /100 | #261 | Tragic 3.16 |
| Immigrants | Russia | 1.3 /100 | #262 | Tragic 3.16 |
| Immigrants | Bulgaria | 1.0 /100 | #263 | Tragic 3.16 |
| Americans | 1.0 /100 | #264 | Tragic 3.16 |
| Immigrants | South Africa | 0.9 /100 | #265 | Tragic 3.16 |
Demographics Similar to Australians by Average Family Size
In terms of average family size, the demographic groups most similar to Australians are Immigrants from Switzerland (3.13, a difference of 0.030%), Immigrants from Latvia (3.13, a difference of 0.050%), British (3.13, a difference of 0.050%), Macedonian (3.13, a difference of 0.060%), and Immigrants from Ireland (3.13, a difference of 0.070%).
| Demographics | Rating | Rank | Average Family Size |
| Colville | 0.2 /100 | #298 | Tragic 3.14 |
| Canadians | 0.2 /100 | #299 | Tragic 3.14 |
| Immigrants | Sweden | 0.2 /100 | #300 | Tragic 3.14 |
| Macedonians | 0.2 /100 | #301 | Tragic 3.13 |
| Immigrants | Latvia | 0.2 /100 | #302 | Tragic 3.13 |
| British | 0.2 /100 | #303 | Tragic 3.13 |
| Immigrants | Switzerland | 0.2 /100 | #304 | Tragic 3.13 |
| Australians | 0.1 /100 | #305 | Tragic 3.13 |
| Immigrants | Ireland | 0.1 /100 | #306 | Tragic 3.13 |
| Immigrants | Serbia | 0.1 /100 | #307 | Tragic 3.13 |
| Slavs | 0.1 /100 | #308 | Tragic 3.13 |
| Northern Europeans | 0.1 /100 | #309 | Tragic 3.13 |
| Czechoslovakians | 0.1 /100 | #310 | Tragic 3.13 |
| Immigrants | Northern Europe | 0.1 /100 | #311 | Tragic 3.13 |
| Immigrants | Australia | 0.1 /100 | #312 | Tragic 3.13 |