Turkish vs Potawatomi Average Family Size
COMPARE
Turkish
Potawatomi
Average Family Size
Average Family Size Comparison
Turks
Potawatomi
3.16
AVERAGE FAMILY SIZE
1.3/ 100
METRIC RATING
258th/ 347
METRIC RANK
3.16
AVERAGE FAMILY SIZE
1.3/ 100
METRIC RATING
259th/ 347
METRIC RANK
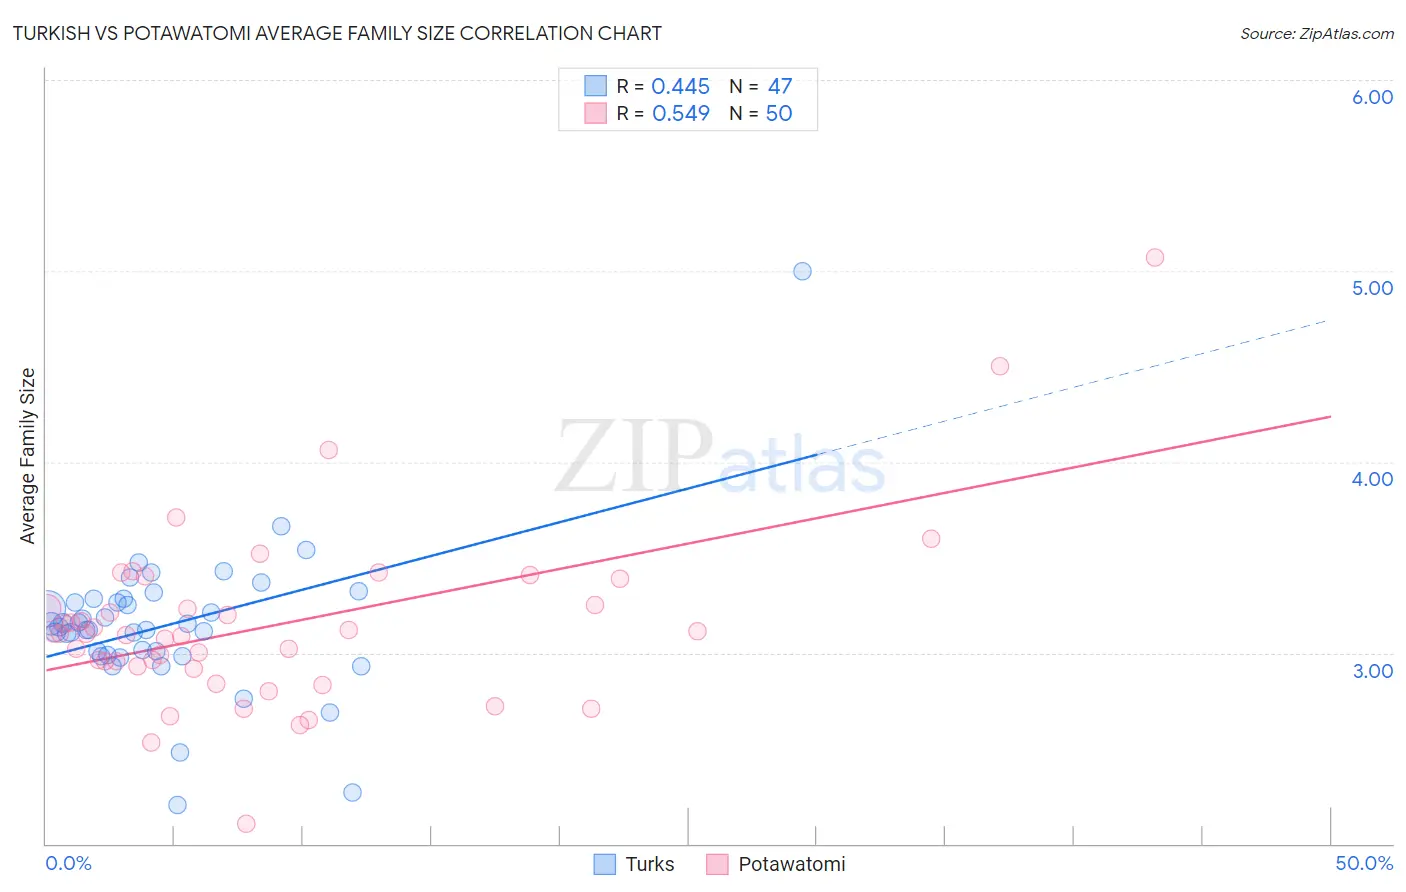
Turkish vs Potawatomi Average Family Size Correlation Chart
The statistical analysis conducted on geographies consisting of 271,710,663 people shows a moderate positive correlation between the proportion of Turks and average family size in the United States with a correlation coefficient (R) of 0.445 and weighted average of 3.16. Similarly, the statistical analysis conducted on geographies consisting of 117,759,864 people shows a substantial positive correlation between the proportion of Potawatomi and average family size in the United States with a correlation coefficient (R) of 0.549 and weighted average of 3.16, a difference of 0.0%.
Average Family Size Correlation Summary
| Measurement | Turkish | Potawatomi |
| Minimum | 2.20 | 2.10 |
| Maximum | 5.00 | 5.07 |
| Range | 2.80 | 2.97 |
| Mean | 3.15 | 3.15 |
| Median | 3.13 | 3.10 |
| Interquartile 25% (IQ1) | 2.99 | 2.93 |
| Interquartile 75% (IQ3) | 3.28 | 3.25 |
| Interquartile Range (IQR) | 0.29 | 0.32 |
| Standard Deviation (Sample) | 0.39 | 0.47 |
| Standard Deviation (Population) | 0.39 | 0.47 |
Demographics Similar to Turks and Potawatomi by Average Family Size
In terms of average family size, the demographic groups most similar to Turks are Immigrants from Albania (3.16, a difference of 0.010%), Immigrants from North Macedonia (3.16, a difference of 0.010%), Immigrants from Russia (3.16, a difference of 0.020%), Albanian (3.17, a difference of 0.050%), and Immigrants from Kazakhstan (3.17, a difference of 0.070%). Similarly, the demographic groups most similar to Potawatomi are Immigrants from Albania (3.16, a difference of 0.0%), Immigrants from North Macedonia (3.16, a difference of 0.010%), Immigrants from Russia (3.16, a difference of 0.020%), Albanian (3.17, a difference of 0.050%), and Immigrants from Kazakhstan (3.17, a difference of 0.080%).
| Demographics | Rating | Rank | Average Family Size |
| Immigrants | Belarus | 2.3 /100 | #248 | Tragic 3.17 |
| Immigrants | Eastern Europe | 2.1 /100 | #249 | Tragic 3.17 |
| Puget Sound Salish | 1.9 /100 | #250 | Tragic 3.17 |
| Immigrants | Spain | 1.8 /100 | #251 | Tragic 3.17 |
| Immigrants | Saudi Arabia | 1.7 /100 | #252 | Tragic 3.17 |
| South Africans | 1.7 /100 | #253 | Tragic 3.17 |
| Immigrants | Hungary | 1.7 /100 | #254 | Tragic 3.17 |
| Cape Verdeans | 1.6 /100 | #255 | Tragic 3.17 |
| Immigrants | Kazakhstan | 1.5 /100 | #256 | Tragic 3.17 |
| Albanians | 1.5 /100 | #257 | Tragic 3.17 |
| Turks | 1.3 /100 | #258 | Tragic 3.16 |
| Potawatomi | 1.3 /100 | #259 | Tragic 3.16 |
| Immigrants | Albania | 1.3 /100 | #260 | Tragic 3.16 |
| Immigrants | North Macedonia | 1.3 /100 | #261 | Tragic 3.16 |
| Immigrants | Russia | 1.3 /100 | #262 | Tragic 3.16 |
| Immigrants | Bulgaria | 1.0 /100 | #263 | Tragic 3.16 |
| Americans | 1.0 /100 | #264 | Tragic 3.16 |
| Immigrants | South Africa | 0.9 /100 | #265 | Tragic 3.16 |
| Immigrants | Greece | 0.9 /100 | #266 | Tragic 3.16 |
| Iroquois | 0.8 /100 | #267 | Tragic 3.16 |
| Maltese | 0.8 /100 | #268 | Tragic 3.16 |