Turkish vs Serbian Average Family Size
COMPARE
Turkish
Serbian
Average Family Size
Average Family Size Comparison
Turks
Serbians
3.16
AVERAGE FAMILY SIZE
1.3/ 100
METRIC RATING
258th/ 347
METRIC RANK
3.12
AVERAGE FAMILY SIZE
0.1/ 100
METRIC RATING
316th/ 347
METRIC RANK
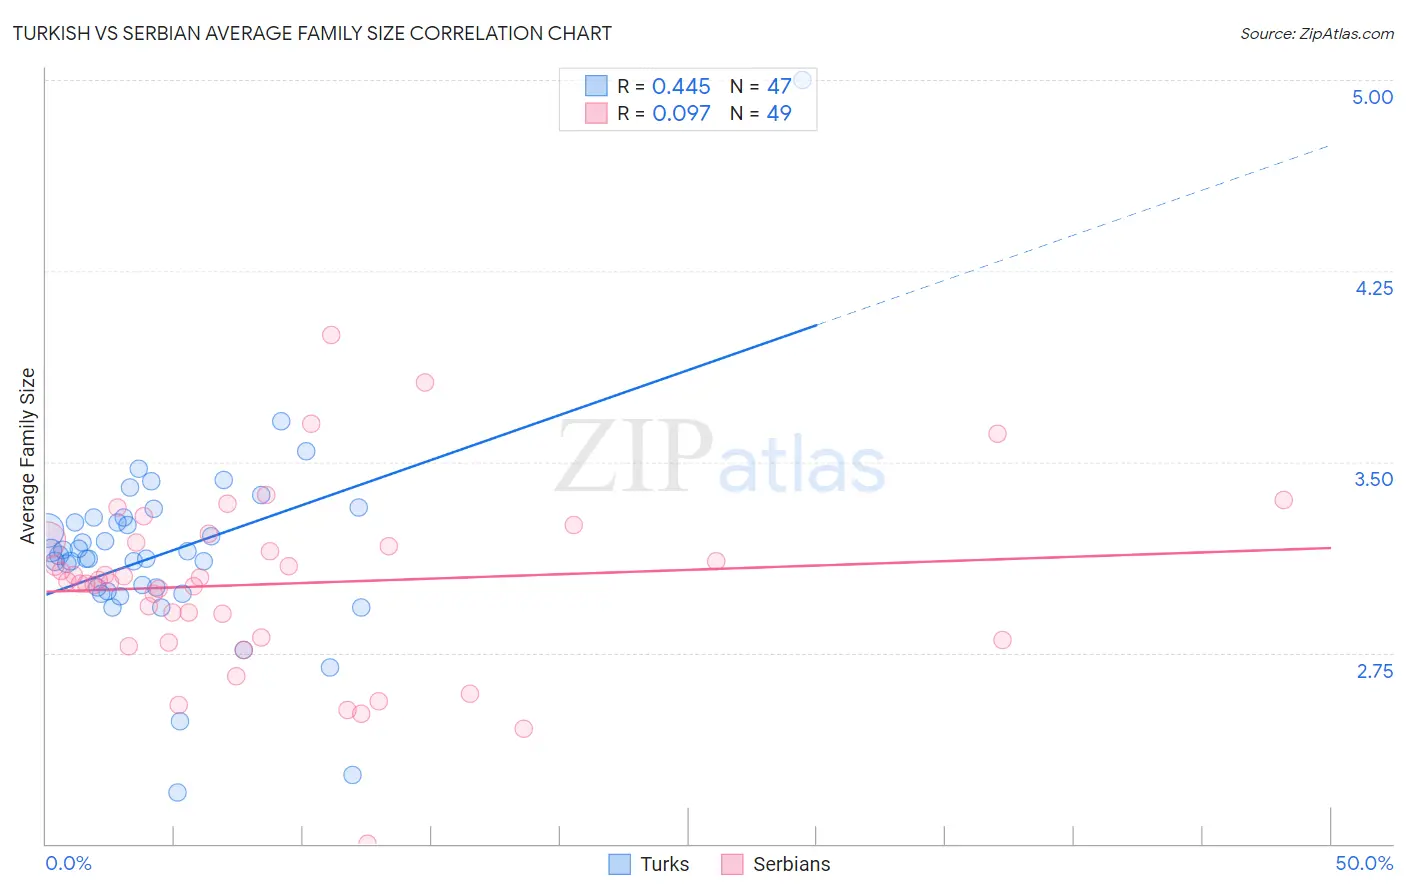
Turkish vs Serbian Average Family Size Correlation Chart
The statistical analysis conducted on geographies consisting of 271,710,663 people shows a moderate positive correlation between the proportion of Turks and average family size in the United States with a correlation coefficient (R) of 0.445 and weighted average of 3.16. Similarly, the statistical analysis conducted on geographies consisting of 267,532,826 people shows a slight positive correlation between the proportion of Serbians and average family size in the United States with a correlation coefficient (R) of 0.097 and weighted average of 3.12, a difference of 1.4%.
Average Family Size Correlation Summary
| Measurement | Turkish | Serbian |
| Minimum | 2.20 | 2.00 |
| Maximum | 5.00 | 4.00 |
| Range | 2.80 | 2.00 |
| Mean | 3.15 | 3.02 |
| Median | 3.13 | 3.03 |
| Interquartile 25% (IQ1) | 2.99 | 2.81 |
| Interquartile 75% (IQ3) | 3.28 | 3.19 |
| Interquartile Range (IQR) | 0.29 | 0.38 |
| Standard Deviation (Sample) | 0.39 | 0.35 |
| Standard Deviation (Population) | 0.39 | 0.35 |
Similar Demographics by Average Family Size
Demographics Similar to Turks by Average Family Size
In terms of average family size, the demographic groups most similar to Turks are Potawatomi (3.16, a difference of 0.0%), Immigrants from Albania (3.16, a difference of 0.010%), Immigrants from North Macedonia (3.16, a difference of 0.010%), Immigrants from Russia (3.16, a difference of 0.020%), and Albanian (3.17, a difference of 0.050%).
| Demographics | Rating | Rank | Average Family Size |
| Immigrants | Spain | 1.8 /100 | #251 | Tragic 3.17 |
| Immigrants | Saudi Arabia | 1.7 /100 | #252 | Tragic 3.17 |
| South Africans | 1.7 /100 | #253 | Tragic 3.17 |
| Immigrants | Hungary | 1.7 /100 | #254 | Tragic 3.17 |
| Cape Verdeans | 1.6 /100 | #255 | Tragic 3.17 |
| Immigrants | Kazakhstan | 1.5 /100 | #256 | Tragic 3.17 |
| Albanians | 1.5 /100 | #257 | Tragic 3.17 |
| Turks | 1.3 /100 | #258 | Tragic 3.16 |
| Potawatomi | 1.3 /100 | #259 | Tragic 3.16 |
| Immigrants | Albania | 1.3 /100 | #260 | Tragic 3.16 |
| Immigrants | North Macedonia | 1.3 /100 | #261 | Tragic 3.16 |
| Immigrants | Russia | 1.3 /100 | #262 | Tragic 3.16 |
| Immigrants | Bulgaria | 1.0 /100 | #263 | Tragic 3.16 |
| Americans | 1.0 /100 | #264 | Tragic 3.16 |
| Immigrants | South Africa | 0.9 /100 | #265 | Tragic 3.16 |
Demographics Similar to Serbians by Average Family Size
In terms of average family size, the demographic groups most similar to Serbians are Italian (3.12, a difference of 0.060%), Eastern European (3.12, a difference of 0.070%), Welsh (3.12, a difference of 0.070%), Immigrants from Scotland (3.12, a difference of 0.090%), and Russian (3.12, a difference of 0.11%).
| Demographics | Rating | Rank | Average Family Size |
| Northern Europeans | 0.1 /100 | #309 | Tragic 3.13 |
| Czechoslovakians | 0.1 /100 | #310 | Tragic 3.13 |
| Immigrants | Northern Europe | 0.1 /100 | #311 | Tragic 3.13 |
| Immigrants | Australia | 0.1 /100 | #312 | Tragic 3.13 |
| Bulgarians | 0.1 /100 | #313 | Tragic 3.13 |
| Russians | 0.1 /100 | #314 | Tragic 3.12 |
| Immigrants | Scotland | 0.1 /100 | #315 | Tragic 3.12 |
| Serbians | 0.1 /100 | #316 | Tragic 3.12 |
| Italians | 0.1 /100 | #317 | Tragic 3.12 |
| Eastern Europeans | 0.1 /100 | #318 | Tragic 3.12 |
| Welsh | 0.1 /100 | #319 | Tragic 3.12 |
| Immigrants | North America | 0.0 /100 | #320 | Tragic 3.12 |
| Immigrants | Austria | 0.0 /100 | #321 | Tragic 3.12 |
| Immigrants | Canada | 0.0 /100 | #322 | Tragic 3.12 |
| Soviet Union | 0.0 /100 | #323 | Tragic 3.11 |