Turkish vs Bolivian Average Family Size
COMPARE
Turkish
Bolivian
Average Family Size
Average Family Size Comparison
Turks
Bolivians
3.16
AVERAGE FAMILY SIZE
1.3/ 100
METRIC RATING
258th/ 347
METRIC RANK
3.29
AVERAGE FAMILY SIZE
98.3/ 100
METRIC RATING
104th/ 347
METRIC RANK
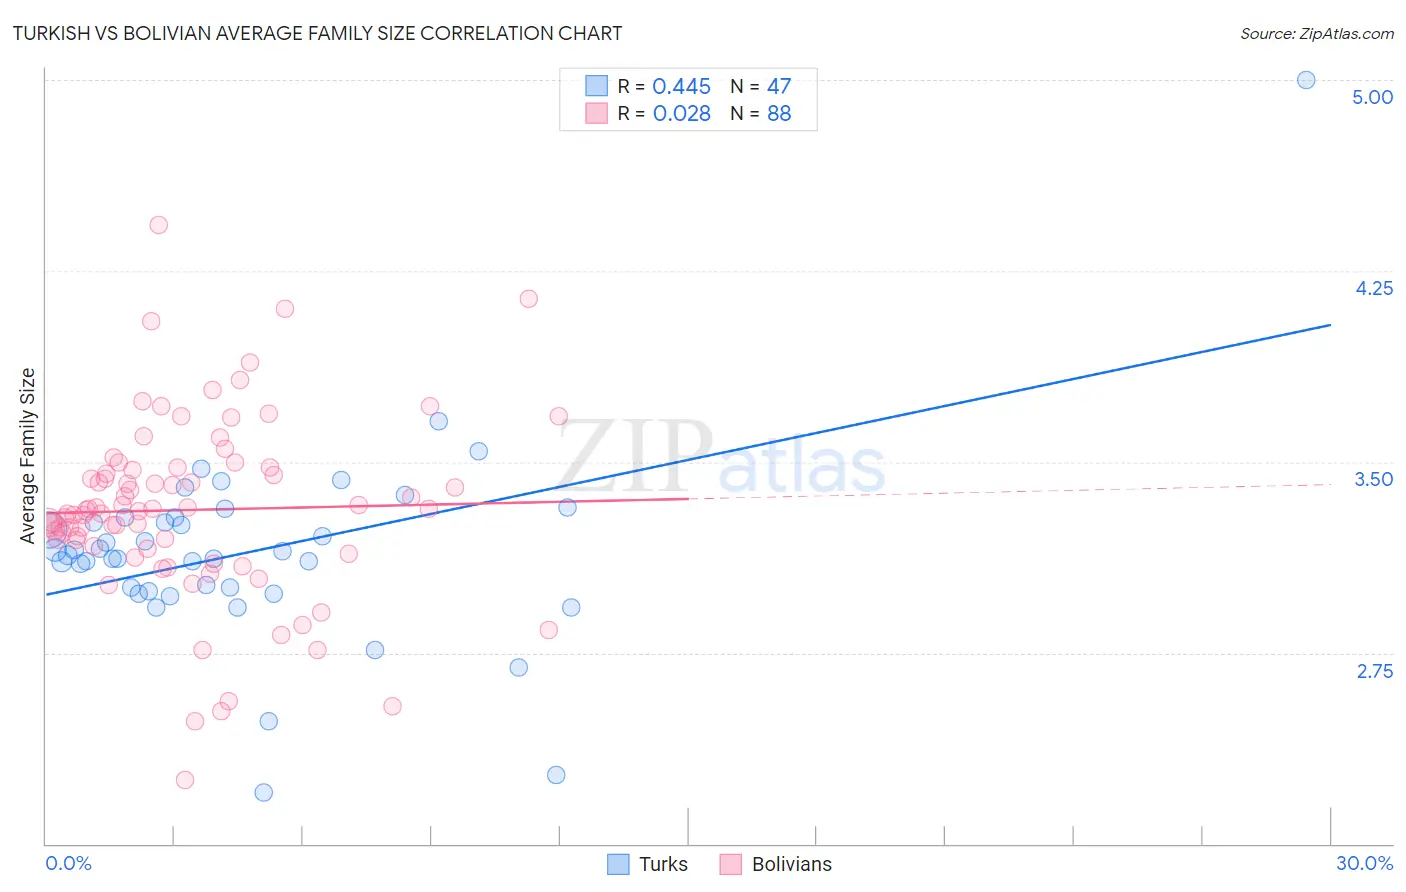
Turkish vs Bolivian Average Family Size Correlation Chart
The statistical analysis conducted on geographies consisting of 271,710,663 people shows a moderate positive correlation between the proportion of Turks and average family size in the United States with a correlation coefficient (R) of 0.445 and weighted average of 3.16. Similarly, the statistical analysis conducted on geographies consisting of 184,628,793 people shows no correlation between the proportion of Bolivians and average family size in the United States with a correlation coefficient (R) of 0.028 and weighted average of 3.29, a difference of 3.9%.
Average Family Size Correlation Summary
| Measurement | Turkish | Bolivian |
| Minimum | 2.20 | 2.25 |
| Maximum | 5.00 | 4.43 |
| Range | 2.80 | 2.18 |
| Mean | 3.15 | 3.31 |
| Median | 3.13 | 3.31 |
| Interquartile 25% (IQ1) | 2.99 | 3.16 |
| Interquartile 75% (IQ3) | 3.28 | 3.47 |
| Interquartile Range (IQR) | 0.29 | 0.31 |
| Standard Deviation (Sample) | 0.39 | 0.36 |
| Standard Deviation (Population) | 0.39 | 0.36 |
Similar Demographics by Average Family Size
Demographics Similar to Turks by Average Family Size
In terms of average family size, the demographic groups most similar to Turks are Potawatomi (3.16, a difference of 0.0%), Immigrants from Albania (3.16, a difference of 0.010%), Immigrants from North Macedonia (3.16, a difference of 0.010%), Immigrants from Russia (3.16, a difference of 0.020%), and Albanian (3.17, a difference of 0.050%).
| Demographics | Rating | Rank | Average Family Size |
| Immigrants | Spain | 1.8 /100 | #251 | Tragic 3.17 |
| Immigrants | Saudi Arabia | 1.7 /100 | #252 | Tragic 3.17 |
| South Africans | 1.7 /100 | #253 | Tragic 3.17 |
| Immigrants | Hungary | 1.7 /100 | #254 | Tragic 3.17 |
| Cape Verdeans | 1.6 /100 | #255 | Tragic 3.17 |
| Immigrants | Kazakhstan | 1.5 /100 | #256 | Tragic 3.17 |
| Albanians | 1.5 /100 | #257 | Tragic 3.17 |
| Turks | 1.3 /100 | #258 | Tragic 3.16 |
| Potawatomi | 1.3 /100 | #259 | Tragic 3.16 |
| Immigrants | Albania | 1.3 /100 | #260 | Tragic 3.16 |
| Immigrants | North Macedonia | 1.3 /100 | #261 | Tragic 3.16 |
| Immigrants | Russia | 1.3 /100 | #262 | Tragic 3.16 |
| Immigrants | Bulgaria | 1.0 /100 | #263 | Tragic 3.16 |
| Americans | 1.0 /100 | #264 | Tragic 3.16 |
| Immigrants | South Africa | 0.9 /100 | #265 | Tragic 3.16 |
Demographics Similar to Bolivians by Average Family Size
In terms of average family size, the demographic groups most similar to Bolivians are Immigrants from Western Africa (3.29, a difference of 0.040%), Immigrants from Ghana (3.29, a difference of 0.050%), Immigrants from Burma/Myanmar (3.29, a difference of 0.070%), West Indian (3.29, a difference of 0.070%), and Paiute (3.29, a difference of 0.070%).
| Demographics | Rating | Rank | Average Family Size |
| Immigrants | Oceania | 98.7 /100 | #97 | Exceptional 3.29 |
| Barbadians | 98.6 /100 | #98 | Exceptional 3.29 |
| Nigerians | 98.6 /100 | #99 | Exceptional 3.29 |
| Guamanians/Chamorros | 98.6 /100 | #100 | Exceptional 3.29 |
| Immigrants | Burma/Myanmar | 98.6 /100 | #101 | Exceptional 3.29 |
| West Indians | 98.5 /100 | #102 | Exceptional 3.29 |
| Immigrants | Western Africa | 98.4 /100 | #103 | Exceptional 3.29 |
| Bolivians | 98.3 /100 | #104 | Exceptional 3.29 |
| Immigrants | Ghana | 98.1 /100 | #105 | Exceptional 3.29 |
| Paiute | 98.0 /100 | #106 | Exceptional 3.29 |
| Ghanaians | 98.0 /100 | #107 | Exceptional 3.29 |
| Asians | 97.0 /100 | #108 | Exceptional 3.28 |
| Puerto Ricans | 96.7 /100 | #109 | Exceptional 3.28 |
| Bahamians | 96.6 /100 | #110 | Exceptional 3.28 |
| Indonesians | 96.2 /100 | #111 | Exceptional 3.28 |