Turkish vs Thai Average Family Size
COMPARE
Turkish
Thai
Average Family Size
Average Family Size Comparison
Turks
Thais
3.16
AVERAGE FAMILY SIZE
1.3/ 100
METRIC RATING
258th/ 347
METRIC RANK
3.22
AVERAGE FAMILY SIZE
38.3/ 100
METRIC RATING
188th/ 347
METRIC RANK
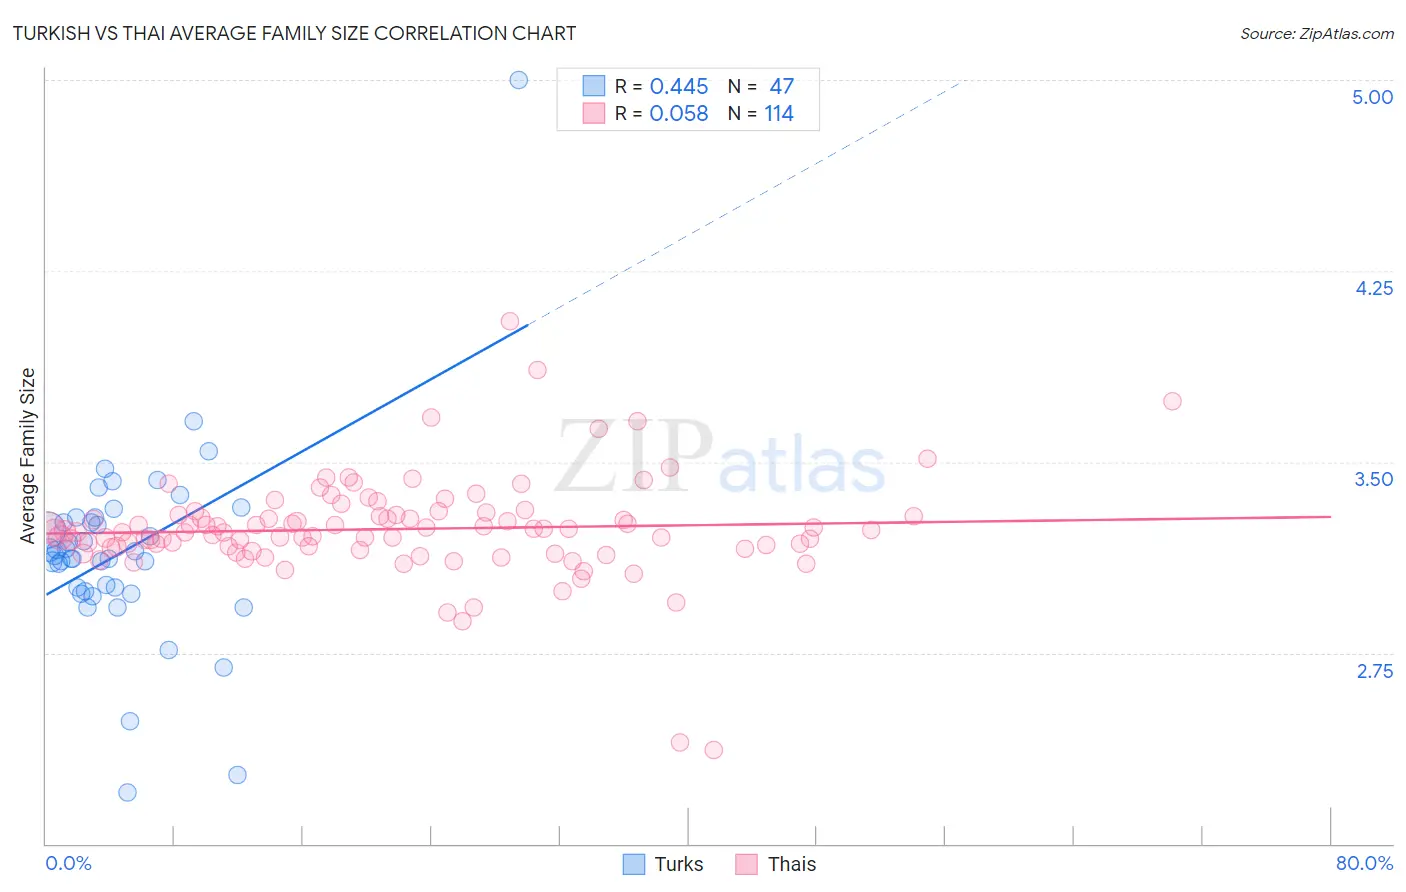
Turkish vs Thai Average Family Size Correlation Chart
The statistical analysis conducted on geographies consisting of 271,710,663 people shows a moderate positive correlation between the proportion of Turks and average family size in the United States with a correlation coefficient (R) of 0.445 and weighted average of 3.16. Similarly, the statistical analysis conducted on geographies consisting of 475,374,663 people shows a slight positive correlation between the proportion of Thais and average family size in the United States with a correlation coefficient (R) of 0.058 and weighted average of 3.22, a difference of 1.8%.
Average Family Size Correlation Summary
| Measurement | Turkish | Thai |
| Minimum | 2.20 | 2.37 |
| Maximum | 5.00 | 4.05 |
| Range | 2.80 | 1.68 |
| Mean | 3.15 | 3.24 |
| Median | 3.13 | 3.22 |
| Interquartile 25% (IQ1) | 2.99 | 3.16 |
| Interquartile 75% (IQ3) | 3.28 | 3.29 |
| Interquartile Range (IQR) | 0.29 | 0.13 |
| Standard Deviation (Sample) | 0.39 | 0.20 |
| Standard Deviation (Population) | 0.39 | 0.20 |
Similar Demographics by Average Family Size
Demographics Similar to Turks by Average Family Size
In terms of average family size, the demographic groups most similar to Turks are Potawatomi (3.16, a difference of 0.0%), Immigrants from Albania (3.16, a difference of 0.010%), Immigrants from North Macedonia (3.16, a difference of 0.010%), Immigrants from Russia (3.16, a difference of 0.020%), and Albanian (3.17, a difference of 0.050%).
| Demographics | Rating | Rank | Average Family Size |
| Immigrants | Spain | 1.8 /100 | #251 | Tragic 3.17 |
| Immigrants | Saudi Arabia | 1.7 /100 | #252 | Tragic 3.17 |
| South Africans | 1.7 /100 | #253 | Tragic 3.17 |
| Immigrants | Hungary | 1.7 /100 | #254 | Tragic 3.17 |
| Cape Verdeans | 1.6 /100 | #255 | Tragic 3.17 |
| Immigrants | Kazakhstan | 1.5 /100 | #256 | Tragic 3.17 |
| Albanians | 1.5 /100 | #257 | Tragic 3.17 |
| Turks | 1.3 /100 | #258 | Tragic 3.16 |
| Potawatomi | 1.3 /100 | #259 | Tragic 3.16 |
| Immigrants | Albania | 1.3 /100 | #260 | Tragic 3.16 |
| Immigrants | North Macedonia | 1.3 /100 | #261 | Tragic 3.16 |
| Immigrants | Russia | 1.3 /100 | #262 | Tragic 3.16 |
| Immigrants | Bulgaria | 1.0 /100 | #263 | Tragic 3.16 |
| Americans | 1.0 /100 | #264 | Tragic 3.16 |
| Immigrants | South Africa | 0.9 /100 | #265 | Tragic 3.16 |
Demographics Similar to Thais by Average Family Size
In terms of average family size, the demographic groups most similar to Thais are Immigrants from Malaysia (3.22, a difference of 0.010%), Immigrants from Sri Lanka (3.22, a difference of 0.030%), Immigrants from Argentina (3.22, a difference of 0.030%), Immigrants from Eastern Asia (3.22, a difference of 0.050%), and Immigrants from Northern Africa (3.22, a difference of 0.070%).
| Demographics | Rating | Rank | Average Family Size |
| Spanish | 44.8 /100 | #181 | Average 3.23 |
| Moroccans | 44.2 /100 | #182 | Average 3.22 |
| Immigrants | Northern Africa | 41.7 /100 | #183 | Average 3.22 |
| Immigrants | Eastern Asia | 40.8 /100 | #184 | Average 3.22 |
| Immigrants | Sri Lanka | 39.8 /100 | #185 | Fair 3.22 |
| Immigrants | Argentina | 39.8 /100 | #186 | Fair 3.22 |
| Immigrants | Malaysia | 39.0 /100 | #187 | Fair 3.22 |
| Thais | 38.3 /100 | #188 | Fair 3.22 |
| Pakistanis | 33.7 /100 | #189 | Fair 3.22 |
| Burmese | 31.0 /100 | #190 | Fair 3.22 |
| Immigrants | Zaire | 30.5 /100 | #191 | Fair 3.22 |
| Immigrants | Eastern Africa | 30.1 /100 | #192 | Fair 3.22 |
| Immigrants | Israel | 29.3 /100 | #193 | Fair 3.22 |
| Immigrants | Sudan | 29.1 /100 | #194 | Fair 3.22 |
| Choctaw | 28.3 /100 | #195 | Fair 3.21 |