Turkish vs Romanian Average Family Size
COMPARE
Turkish
Romanian
Average Family Size
Average Family Size Comparison
Turks
Romanians
3.16
AVERAGE FAMILY SIZE
1.3/ 100
METRIC RATING
258th/ 347
METRIC RANK
3.18
AVERAGE FAMILY SIZE
3.7/ 100
METRIC RATING
238th/ 347
METRIC RANK
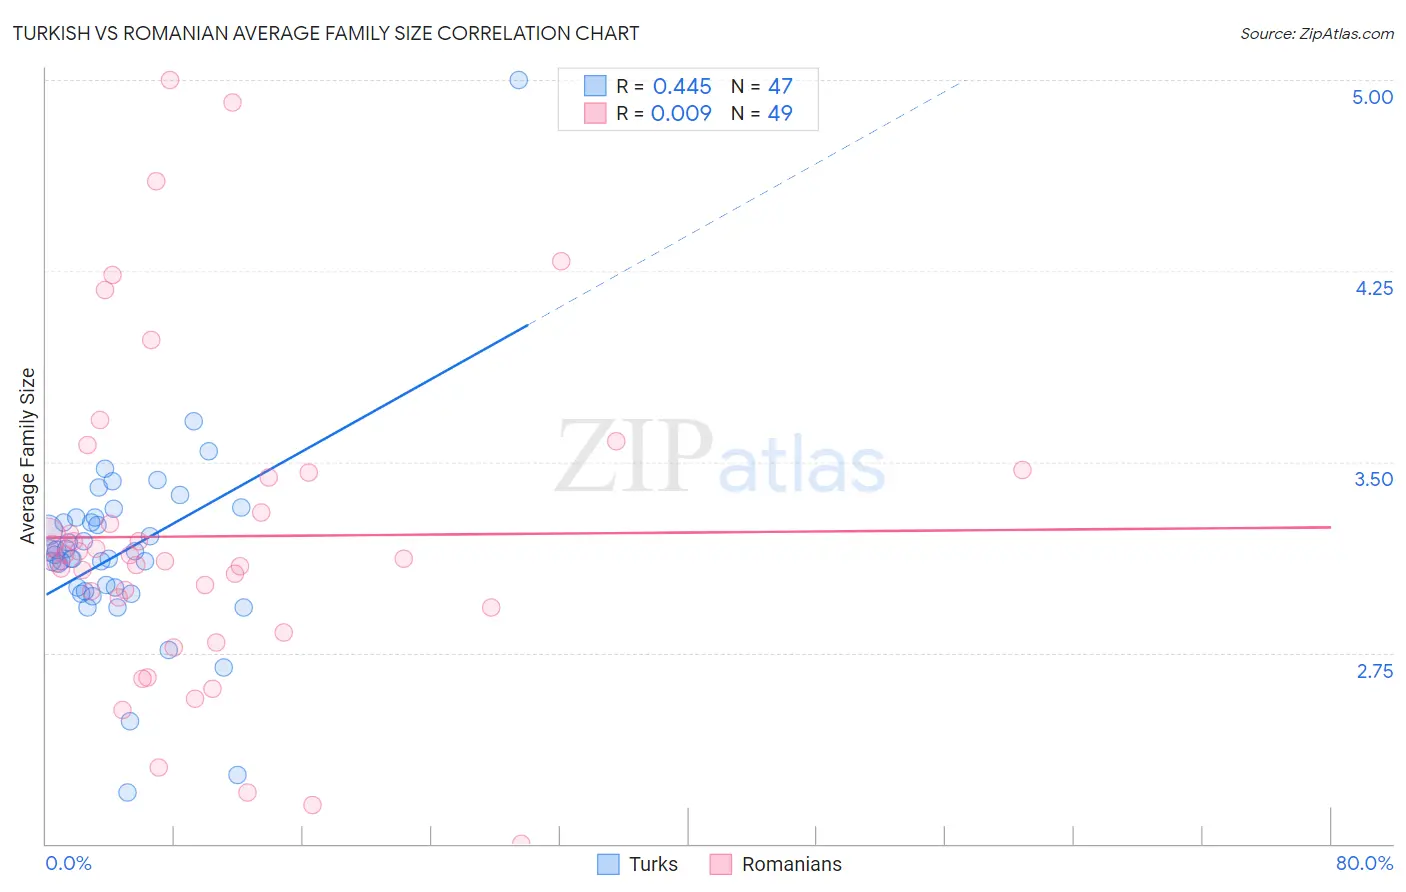
Turkish vs Romanian Average Family Size Correlation Chart
The statistical analysis conducted on geographies consisting of 271,710,663 people shows a moderate positive correlation between the proportion of Turks and average family size in the United States with a correlation coefficient (R) of 0.445 and weighted average of 3.16. Similarly, the statistical analysis conducted on geographies consisting of 377,712,240 people shows no correlation between the proportion of Romanians and average family size in the United States with a correlation coefficient (R) of 0.009 and weighted average of 3.18, a difference of 0.50%.
Average Family Size Correlation Summary
| Measurement | Turkish | Romanian |
| Minimum | 2.20 | 2.00 |
| Maximum | 5.00 | 5.00 |
| Range | 2.80 | 3.00 |
| Mean | 3.15 | 3.21 |
| Median | 3.13 | 3.12 |
| Interquartile 25% (IQ1) | 2.99 | 2.88 |
| Interquartile 75% (IQ3) | 3.28 | 3.45 |
| Interquartile Range (IQR) | 0.29 | 0.57 |
| Standard Deviation (Sample) | 0.39 | 0.64 |
| Standard Deviation (Population) | 0.39 | 0.63 |
Demographics Similar to Turks and Romanians by Average Family Size
In terms of average family size, the demographic groups most similar to Turks are Albanian (3.17, a difference of 0.050%), Immigrants from Kazakhstan (3.17, a difference of 0.070%), Cape Verdean (3.17, a difference of 0.10%), Immigrants from Hungary (3.17, a difference of 0.11%), and Immigrants from Saudi Arabia (3.17, a difference of 0.12%). Similarly, the demographic groups most similar to Romanians are Houma (3.18, a difference of 0.050%), Osage (3.18, a difference of 0.070%), Immigrants from Japan (3.18, a difference of 0.10%), Hungarian (3.18, a difference of 0.11%), and Immigrants from Moldova (3.18, a difference of 0.12%).
| Demographics | Rating | Rank | Average Family Size |
| Romanians | 3.7 /100 | #238 | Tragic 3.18 |
| Houma | 3.4 /100 | #239 | Tragic 3.18 |
| Osage | 3.2 /100 | #240 | Tragic 3.18 |
| Immigrants | Japan | 3.0 /100 | #241 | Tragic 3.18 |
| Hungarians | 3.0 /100 | #242 | Tragic 3.18 |
| Immigrants | Moldova | 2.9 /100 | #243 | Tragic 3.18 |
| Immigrants | Southern Europe | 2.9 /100 | #244 | Tragic 3.18 |
| Immigrants | Brazil | 2.7 /100 | #245 | Tragic 3.18 |
| Danes | 2.5 /100 | #246 | Tragic 3.17 |
| Cajuns | 2.4 /100 | #247 | Tragic 3.17 |
| Immigrants | Belarus | 2.3 /100 | #248 | Tragic 3.17 |
| Immigrants | Eastern Europe | 2.1 /100 | #249 | Tragic 3.17 |
| Puget Sound Salish | 1.9 /100 | #250 | Tragic 3.17 |
| Immigrants | Spain | 1.8 /100 | #251 | Tragic 3.17 |
| Immigrants | Saudi Arabia | 1.7 /100 | #252 | Tragic 3.17 |
| South Africans | 1.7 /100 | #253 | Tragic 3.17 |
| Immigrants | Hungary | 1.7 /100 | #254 | Tragic 3.17 |
| Cape Verdeans | 1.6 /100 | #255 | Tragic 3.17 |
| Immigrants | Kazakhstan | 1.5 /100 | #256 | Tragic 3.17 |
| Albanians | 1.5 /100 | #257 | Tragic 3.17 |
| Turks | 1.3 /100 | #258 | Tragic 3.16 |