Tohono O'odham vs South American Family Households
COMPARE
Tohono O'odham
South American
Family Households
Family Households Comparison
Tohono O'odham
South Americans
67.1%
FAMILY HOUSEHOLDS
100.0/ 100
METRIC RATING
35th/ 347
METRIC RANK
66.0%
FAMILY HOUSEHOLDS
100.0/ 100
METRIC RATING
60th/ 347
METRIC RANK
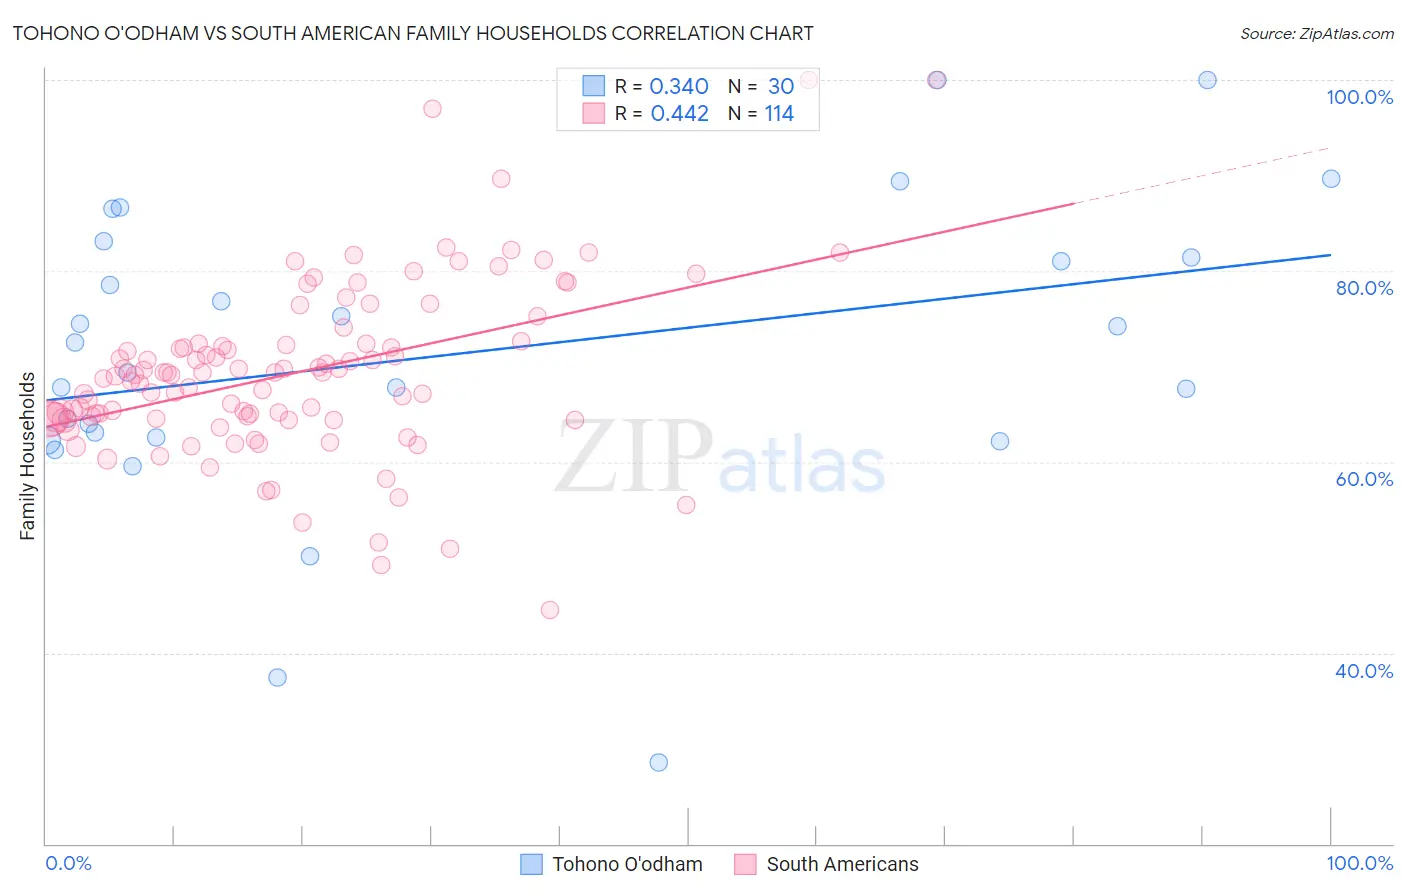
Tohono O'odham vs South American Family Households Correlation Chart
The statistical analysis conducted on geographies consisting of 58,718,905 people shows a mild positive correlation between the proportion of Tohono O'odham and percentage of family households in the United States with a correlation coefficient (R) of 0.340 and weighted average of 67.1%. Similarly, the statistical analysis conducted on geographies consisting of 493,649,007 people shows a moderate positive correlation between the proportion of South Americans and percentage of family households in the United States with a correlation coefficient (R) of 0.442 and weighted average of 66.0%, a difference of 1.7%.
Family Households Correlation Summary
| Measurement | Tohono O'odham | South American |
| Minimum | 28.6% | 44.4% |
| Maximum | 100.0% | 100.0% |
| Range | 71.4% | 55.6% |
| Mean | 71.3% | 69.3% |
| Median | 71.0% | 69.1% |
| Interquartile 25% (IQ1) | 62.6% | 64.5% |
| Interquartile 75% (IQ3) | 81.4% | 72.3% |
| Interquartile Range (IQR) | 18.8% | 7.8% |
| Standard Deviation (Sample) | 15.9% | 9.1% |
| Standard Deviation (Population) | 15.7% | 9.1% |
Similar Demographics by Family Households
Demographics Similar to Tohono O'odham by Family Households
In terms of family households, the demographic groups most similar to Tohono O'odham are Peruvian (67.1%, a difference of 0.010%), Salvadoran (67.2%, a difference of 0.050%), Thai (67.2%, a difference of 0.050%), Tsimshian (67.1%, a difference of 0.080%), and Nepalese (67.2%, a difference of 0.090%).
| Demographics | Rating | Rank | Family Households |
| Hawaiians | 100.0 /100 | #28 | Exceptional 67.4% |
| Nicaraguans | 100.0 /100 | #29 | Exceptional 67.4% |
| Immigrants | Peru | 100.0 /100 | #30 | Exceptional 67.2% |
| Immigrants | Latin America | 100.0 /100 | #31 | Exceptional 67.2% |
| Nepalese | 100.0 /100 | #32 | Exceptional 67.2% |
| Salvadorans | 100.0 /100 | #33 | Exceptional 67.2% |
| Thais | 100.0 /100 | #34 | Exceptional 67.2% |
| Tohono O'odham | 100.0 /100 | #35 | Exceptional 67.1% |
| Peruvians | 100.0 /100 | #36 | Exceptional 67.1% |
| Tsimshian | 100.0 /100 | #37 | Exceptional 67.1% |
| Mexican American Indians | 100.0 /100 | #38 | Exceptional 67.0% |
| Immigrants | El Salvador | 100.0 /100 | #39 | Exceptional 67.0% |
| Guamanians/Chamorros | 100.0 /100 | #40 | Exceptional 66.6% |
| Immigrants | Bolivia | 100.0 /100 | #41 | Exceptional 66.6% |
| Menominee | 100.0 /100 | #42 | Exceptional 66.5% |
Demographics Similar to South Americans by Family Households
In terms of family households, the demographic groups most similar to South Americans are Immigrants from Korea (66.0%, a difference of 0.010%), Danish (66.0%, a difference of 0.020%), Immigrants from Asia (66.1%, a difference of 0.030%), Central American (66.0%, a difference of 0.050%), and Immigrants from Indonesia (66.0%, a difference of 0.090%).
| Demographics | Rating | Rank | Family Households |
| Afghans | 100.0 /100 | #53 | Exceptional 66.3% |
| Immigrants | Colombia | 100.0 /100 | #54 | Exceptional 66.3% |
| Immigrants | Immigrants | 100.0 /100 | #55 | Exceptional 66.1% |
| Immigrants | Hong Kong | 100.0 /100 | #56 | Exceptional 66.1% |
| Pennsylvania Germans | 100.0 /100 | #57 | Exceptional 66.1% |
| Immigrants | Asia | 100.0 /100 | #58 | Exceptional 66.1% |
| Immigrants | Korea | 100.0 /100 | #59 | Exceptional 66.0% |
| South Americans | 100.0 /100 | #60 | Exceptional 66.0% |
| Danes | 100.0 /100 | #61 | Exceptional 66.0% |
| Central Americans | 100.0 /100 | #62 | Exceptional 66.0% |
| Immigrants | Indonesia | 100.0 /100 | #63 | Exceptional 66.0% |
| Pima | 99.9 /100 | #64 | Exceptional 65.9% |
| Costa Ricans | 99.9 /100 | #65 | Exceptional 65.9% |
| Fijians | 99.9 /100 | #66 | Exceptional 65.9% |
| Filipinos | 99.9 /100 | #67 | Exceptional 65.9% |