Tohono O'odham vs Immigrants from Lithuania In Labor Force | Age 35-44
COMPARE
Tohono O'odham
Immigrants from Lithuania
In Labor Force | Age 35-44
In Labor Force | Age 35-44 Comparison
Tohono O'odham
Immigrants from Lithuania
74.1%
IN LABOR FORCE | AGE 35-44
0.0/ 100
METRIC RATING
346th/ 347
METRIC RANK
85.4%
IN LABOR FORCE | AGE 35-44
99.9/ 100
METRIC RATING
27th/ 347
METRIC RANK
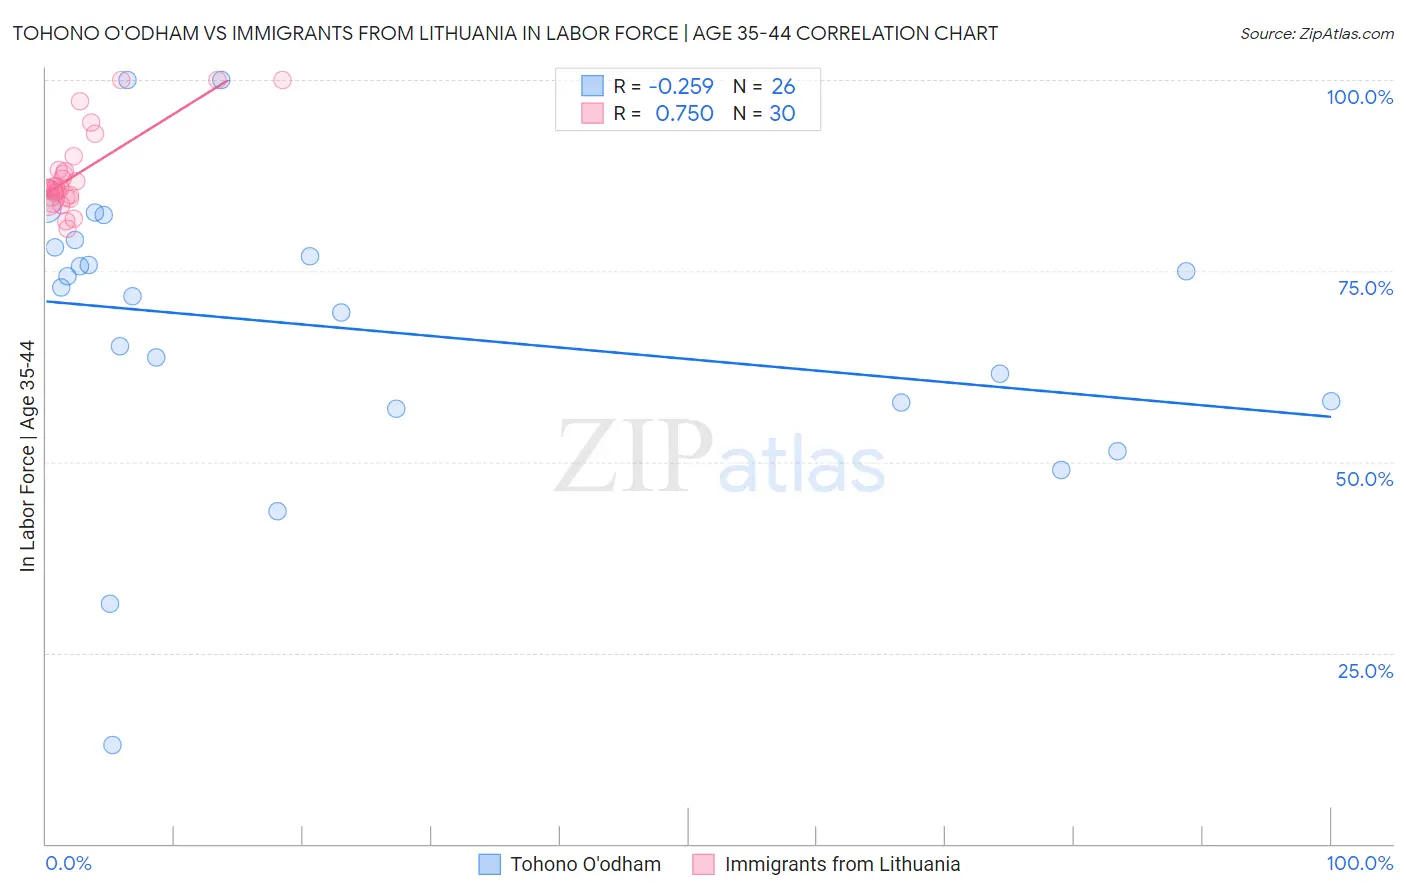
Tohono O'odham vs Immigrants from Lithuania In Labor Force | Age 35-44 Correlation Chart
The statistical analysis conducted on geographies consisting of 58,719,465 people shows a weak negative correlation between the proportion of Tohono O'odham and labor force participation rate among population between the ages 35 and 44 in the United States with a correlation coefficient (R) of -0.259 and weighted average of 74.1%. Similarly, the statistical analysis conducted on geographies consisting of 117,719,868 people shows a strong positive correlation between the proportion of Immigrants from Lithuania and labor force participation rate among population between the ages 35 and 44 in the United States with a correlation coefficient (R) of 0.750 and weighted average of 85.4%, a difference of 15.2%.
In Labor Force | Age 35-44 Correlation Summary
| Measurement | Tohono O'odham | Immigrants from Lithuania |
| Minimum | 13.0% | 80.5% |
| Maximum | 100.0% | 100.0% |
| Range | 87.0% | 19.5% |
| Mean | 67.2% | 87.7% |
| Median | 72.2% | 85.8% |
| Interquartile 25% (IQ1) | 57.8% | 84.7% |
| Interquartile 75% (IQ3) | 78.1% | 88.2% |
| Interquartile Range (IQR) | 20.3% | 3.6% |
| Standard Deviation (Sample) | 19.2% | 5.5% |
| Standard Deviation (Population) | 18.8% | 5.4% |
Similar Demographics by In Labor Force | Age 35-44
Demographics Similar to Tohono O'odham by In Labor Force | Age 35-44
In terms of in labor force | age 35-44, the demographic groups most similar to Tohono O'odham are Navajo (73.8%, a difference of 0.38%), Yuman (74.7%, a difference of 0.83%), Pima (74.8%, a difference of 0.96%), Immigrants from Yemen (76.3%, a difference of 2.9%), and Crow (76.5%, a difference of 3.2%).
| Demographics | Rating | Rank | In Labor Force | Age 35-44 |
| Kiowa | 0.0 /100 | #333 | Tragic 79.2% |
| Yakama | 0.0 /100 | #334 | Tragic 79.0% |
| Natives/Alaskans | 0.0 /100 | #335 | Tragic 78.9% |
| Arapaho | 0.0 /100 | #336 | Tragic 78.1% |
| Apache | 0.0 /100 | #337 | Tragic 77.9% |
| Pueblo | 0.0 /100 | #338 | Tragic 77.4% |
| Yup'ik | 0.0 /100 | #339 | Tragic 77.3% |
| Lumbee | 0.0 /100 | #340 | Tragic 77.0% |
| Hopi | 0.0 /100 | #341 | Tragic 77.0% |
| Crow | 0.0 /100 | #342 | Tragic 76.5% |
| Immigrants | Yemen | 0.0 /100 | #343 | Tragic 76.3% |
| Pima | 0.0 /100 | #344 | Tragic 74.8% |
| Yuman | 0.0 /100 | #345 | Tragic 74.7% |
| Tohono O'odham | 0.0 /100 | #346 | Tragic 74.1% |
| Navajo | 0.0 /100 | #347 | Tragic 73.8% |
Demographics Similar to Immigrants from Lithuania by In Labor Force | Age 35-44
In terms of in labor force | age 35-44, the demographic groups most similar to Immigrants from Lithuania are Paraguayan (85.4%, a difference of 0.0%), Immigrants from Liberia (85.4%, a difference of 0.0%), Immigrants from Greece (85.3%, a difference of 0.010%), Latvian (85.4%, a difference of 0.020%), and Cambodian (85.3%, a difference of 0.050%).
| Demographics | Rating | Rank | In Labor Force | Age 35-44 |
| Immigrants | Serbia | 100.0 /100 | #20 | Exceptional 85.5% |
| Bulgarians | 100.0 /100 | #21 | Exceptional 85.5% |
| Immigrants | Bosnia and Herzegovina | 100.0 /100 | #22 | Exceptional 85.4% |
| Immigrants | Eastern Africa | 100.0 /100 | #23 | Exceptional 85.4% |
| Latvians | 99.9 /100 | #24 | Exceptional 85.4% |
| Paraguayans | 99.9 /100 | #25 | Exceptional 85.4% |
| Immigrants | Liberia | 99.9 /100 | #26 | Exceptional 85.4% |
| Immigrants | Lithuania | 99.9 /100 | #27 | Exceptional 85.4% |
| Immigrants | Greece | 99.9 /100 | #28 | Exceptional 85.3% |
| Cambodians | 99.9 /100 | #29 | Exceptional 85.3% |
| Bermudans | 99.9 /100 | #30 | Exceptional 85.3% |
| Czechs | 99.9 /100 | #31 | Exceptional 85.3% |
| Immigrants | India | 99.9 /100 | #32 | Exceptional 85.3% |
| Ugandans | 99.9 /100 | #33 | Exceptional 85.3% |
| Immigrants | Nepal | 99.9 /100 | #34 | Exceptional 85.3% |