Tohono O'odham vs Immigrants from Costa Rica Family Households
COMPARE
Tohono O'odham
Immigrants from Costa Rica
Family Households
Family Households Comparison
Tohono O'odham
Immigrants from Costa Rica
67.1%
FAMILY HOUSEHOLDS
100.0/ 100
METRIC RATING
35th/ 347
METRIC RANK
65.6%
FAMILY HOUSEHOLDS
99.8/ 100
METRIC RATING
79th/ 347
METRIC RANK
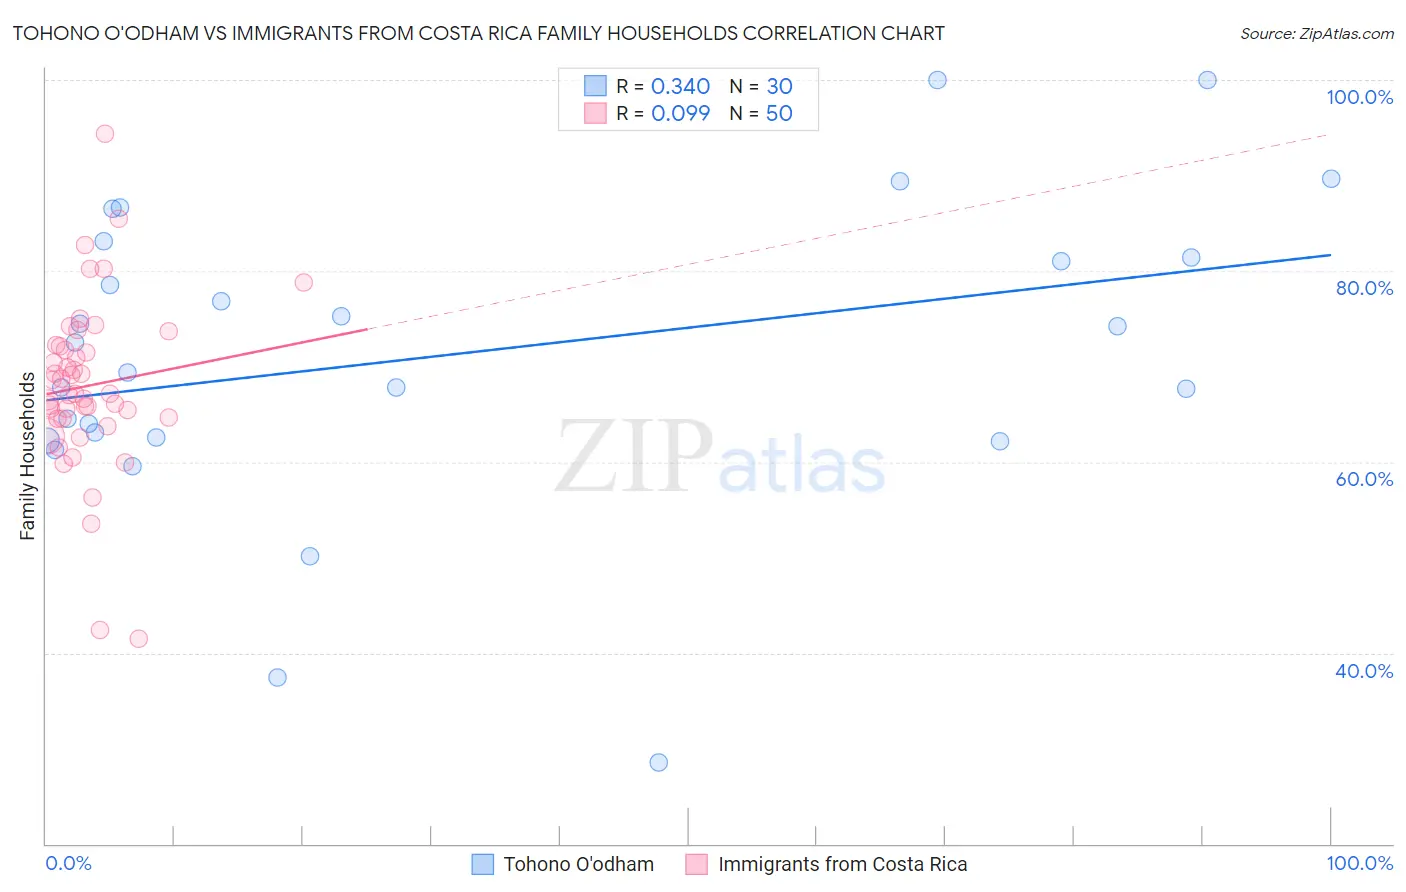
Tohono O'odham vs Immigrants from Costa Rica Family Households Correlation Chart
The statistical analysis conducted on geographies consisting of 58,718,905 people shows a mild positive correlation between the proportion of Tohono O'odham and percentage of family households in the United States with a correlation coefficient (R) of 0.340 and weighted average of 67.1%. Similarly, the statistical analysis conducted on geographies consisting of 204,251,073 people shows a slight positive correlation between the proportion of Immigrants from Costa Rica and percentage of family households in the United States with a correlation coefficient (R) of 0.099 and weighted average of 65.6%, a difference of 2.3%.
Family Households Correlation Summary
| Measurement | Tohono O'odham | Immigrants from Costa Rica |
| Minimum | 28.6% | 41.4% |
| Maximum | 100.0% | 94.4% |
| Range | 71.4% | 52.9% |
| Mean | 71.3% | 68.0% |
| Median | 71.0% | 67.1% |
| Interquartile 25% (IQ1) | 62.6% | 64.6% |
| Interquartile 75% (IQ3) | 81.4% | 72.1% |
| Interquartile Range (IQR) | 18.8% | 7.5% |
| Standard Deviation (Sample) | 15.9% | 9.0% |
| Standard Deviation (Population) | 15.7% | 9.0% |
Similar Demographics by Family Households
Demographics Similar to Tohono O'odham by Family Households
In terms of family households, the demographic groups most similar to Tohono O'odham are Peruvian (67.1%, a difference of 0.010%), Salvadoran (67.2%, a difference of 0.050%), Thai (67.2%, a difference of 0.050%), Tsimshian (67.1%, a difference of 0.080%), and Nepalese (67.2%, a difference of 0.090%).
| Demographics | Rating | Rank | Family Households |
| Hawaiians | 100.0 /100 | #28 | Exceptional 67.4% |
| Nicaraguans | 100.0 /100 | #29 | Exceptional 67.4% |
| Immigrants | Peru | 100.0 /100 | #30 | Exceptional 67.2% |
| Immigrants | Latin America | 100.0 /100 | #31 | Exceptional 67.2% |
| Nepalese | 100.0 /100 | #32 | Exceptional 67.2% |
| Salvadorans | 100.0 /100 | #33 | Exceptional 67.2% |
| Thais | 100.0 /100 | #34 | Exceptional 67.2% |
| Tohono O'odham | 100.0 /100 | #35 | Exceptional 67.1% |
| Peruvians | 100.0 /100 | #36 | Exceptional 67.1% |
| Tsimshian | 100.0 /100 | #37 | Exceptional 67.1% |
| Mexican American Indians | 100.0 /100 | #38 | Exceptional 67.0% |
| Immigrants | El Salvador | 100.0 /100 | #39 | Exceptional 67.0% |
| Guamanians/Chamorros | 100.0 /100 | #40 | Exceptional 66.6% |
| Immigrants | Bolivia | 100.0 /100 | #41 | Exceptional 66.6% |
| Menominee | 100.0 /100 | #42 | Exceptional 66.5% |
Demographics Similar to Immigrants from Costa Rica by Family Households
In terms of family households, the demographic groups most similar to Immigrants from Costa Rica are Puget Sound Salish (65.6%, a difference of 0.010%), Yaqui (65.6%, a difference of 0.030%), Immigrants from the Azores (65.6%, a difference of 0.040%), Immigrants from South America (65.6%, a difference of 0.040%), and Jordanian (65.5%, a difference of 0.10%).
| Demographics | Rating | Rank | Family Households |
| Portuguese | 99.9 /100 | #72 | Exceptional 65.8% |
| Laotians | 99.9 /100 | #73 | Exceptional 65.8% |
| Burmese | 99.9 /100 | #74 | Exceptional 65.7% |
| Houma | 99.9 /100 | #75 | Exceptional 65.7% |
| Immigrants | Azores | 99.8 /100 | #76 | Exceptional 65.6% |
| Immigrants | South America | 99.8 /100 | #77 | Exceptional 65.6% |
| Yaqui | 99.8 /100 | #78 | Exceptional 65.6% |
| Immigrants | Costa Rica | 99.8 /100 | #79 | Exceptional 65.6% |
| Puget Sound Salish | 99.8 /100 | #80 | Exceptional 65.6% |
| Jordanians | 99.7 /100 | #81 | Exceptional 65.5% |
| Immigrants | Lebanon | 99.7 /100 | #82 | Exceptional 65.5% |
| Immigrants | Guyana | 99.6 /100 | #83 | Exceptional 65.5% |
| Americans | 99.6 /100 | #84 | Exceptional 65.5% |
| Immigrants | Cambodia | 99.5 /100 | #85 | Exceptional 65.4% |
| Egyptians | 99.4 /100 | #86 | Exceptional 65.4% |