Tohono O'odham vs Immigrants from Sri Lanka Married-couple Households
COMPARE
Tohono O'odham
Immigrants from Sri Lanka
Married-couple Households
Married-couple Households Comparison
Tohono O'odham
Immigrants from Sri Lanka
37.9%
MARRIED-COUPLE HOUSEHOLDS
0.0/ 100
METRIC RATING
342nd/ 347
METRIC RANK
48.7%
MARRIED-COUPLE HOUSEHOLDS
99.4/ 100
METRIC RATING
49th/ 347
METRIC RANK
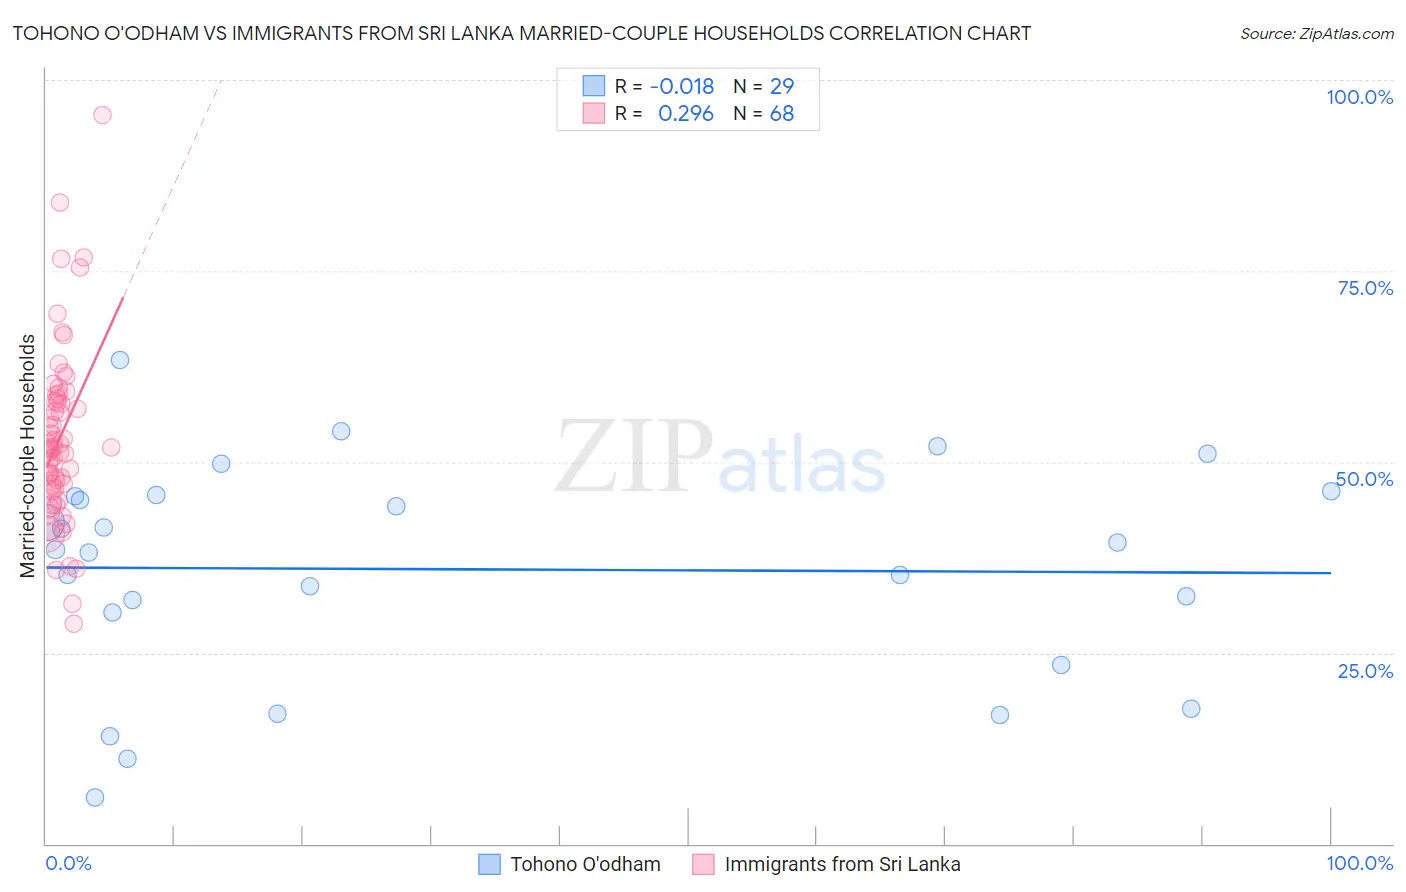
Tohono O'odham vs Immigrants from Sri Lanka Married-couple Households Correlation Chart
The statistical analysis conducted on geographies consisting of 58,718,357 people shows no correlation between the proportion of Tohono O'odham and percentage of married-couple family households in the United States with a correlation coefficient (R) of -0.018 and weighted average of 37.9%. Similarly, the statistical analysis conducted on geographies consisting of 149,682,536 people shows a weak positive correlation between the proportion of Immigrants from Sri Lanka and percentage of married-couple family households in the United States with a correlation coefficient (R) of 0.296 and weighted average of 48.7%, a difference of 28.4%.
Married-couple Households Correlation Summary
| Measurement | Tohono O'odham | Immigrants from Sri Lanka |
| Minimum | 6.1% | 28.8% |
| Maximum | 63.4% | 95.4% |
| Range | 57.3% | 66.7% |
| Mean | 35.9% | 53.1% |
| Median | 38.5% | 51.8% |
| Interquartile 25% (IQ1) | 26.9% | 46.8% |
| Interquartile 75% (IQ3) | 45.6% | 58.1% |
| Interquartile Range (IQR) | 18.7% | 11.3% |
| Standard Deviation (Sample) | 14.1% | 11.6% |
| Standard Deviation (Population) | 13.9% | 11.5% |
Similar Demographics by Married-couple Households
Demographics Similar to Tohono O'odham by Married-couple Households
In terms of married-couple households, the demographic groups most similar to Tohono O'odham are Cape Verdean (38.1%, a difference of 0.60%), Dominican (38.2%, a difference of 0.73%), Immigrants from Grenada (37.5%, a difference of 1.1%), British West Indian (38.3%, a difference of 1.1%), and Immigrants from Senegal (38.4%, a difference of 1.2%).
| Demographics | Rating | Rank | Married-couple Households |
| Immigrants | West Indies | 0.0 /100 | #333 | Tragic 39.0% |
| Immigrants | St. Vincent and the Grenadines | 0.0 /100 | #334 | Tragic 38.7% |
| Senegalese | 0.0 /100 | #335 | Tragic 38.6% |
| Blacks/African Americans | 0.0 /100 | #336 | Tragic 38.5% |
| Immigrants | Somalia | 0.0 /100 | #337 | Tragic 38.4% |
| Immigrants | Senegal | 0.0 /100 | #338 | Tragic 38.4% |
| British West Indians | 0.0 /100 | #339 | Tragic 38.3% |
| Dominicans | 0.0 /100 | #340 | Tragic 38.2% |
| Cape Verdeans | 0.0 /100 | #341 | Tragic 38.1% |
| Tohono O'odham | 0.0 /100 | #342 | Tragic 37.9% |
| Immigrants | Grenada | 0.0 /100 | #343 | Tragic 37.5% |
| Immigrants | Dominican Republic | 0.0 /100 | #344 | Tragic 37.3% |
| Hopi | 0.0 /100 | #345 | Tragic 36.7% |
| Immigrants | Cabo Verde | 0.0 /100 | #346 | Tragic 36.2% |
| Pima | 0.0 /100 | #347 | Tragic 35.6% |
Demographics Similar to Immigrants from Sri Lanka by Married-couple Households
In terms of married-couple households, the demographic groups most similar to Immigrants from Sri Lanka are Samoan (48.7%, a difference of 0.040%), Indian (Asian) (48.7%, a difference of 0.060%), Eastern European (48.6%, a difference of 0.080%), British (48.7%, a difference of 0.12%), and Irish (48.6%, a difference of 0.12%).
| Demographics | Rating | Rank | Married-couple Households |
| Immigrants | Vietnam | 99.6 /100 | #42 | Exceptional 48.8% |
| Immigrants | Iran | 99.6 /100 | #43 | Exceptional 48.8% |
| Welsh | 99.5 /100 | #44 | Exceptional 48.8% |
| Immigrants | Eastern Asia | 99.5 /100 | #45 | Exceptional 48.8% |
| Tsimshian | 99.5 /100 | #46 | Exceptional 48.7% |
| British | 99.5 /100 | #47 | Exceptional 48.7% |
| Indians (Asian) | 99.4 /100 | #48 | Exceptional 48.7% |
| Immigrants | Sri Lanka | 99.4 /100 | #49 | Exceptional 48.7% |
| Samoans | 99.4 /100 | #50 | Exceptional 48.7% |
| Eastern Europeans | 99.3 /100 | #51 | Exceptional 48.6% |
| Irish | 99.3 /100 | #52 | Exceptional 48.6% |
| Whites/Caucasians | 99.3 /100 | #53 | Exceptional 48.6% |
| Immigrants | Lithuania | 99.3 /100 | #54 | Exceptional 48.6% |
| Austrians | 99.3 /100 | #55 | Exceptional 48.6% |
| Immigrants | Northern Europe | 99.3 /100 | #56 | Exceptional 48.6% |