Tohono O'odham vs Bhutanese Married-couple Households
COMPARE
Tohono O'odham
Bhutanese
Married-couple Households
Married-couple Households Comparison
Tohono O'odham
Bhutanese
37.9%
MARRIED-COUPLE HOUSEHOLDS
0.0/ 100
METRIC RATING
342nd/ 347
METRIC RANK
49.3%
MARRIED-COUPLE HOUSEHOLDS
99.8/ 100
METRIC RATING
27th/ 347
METRIC RANK
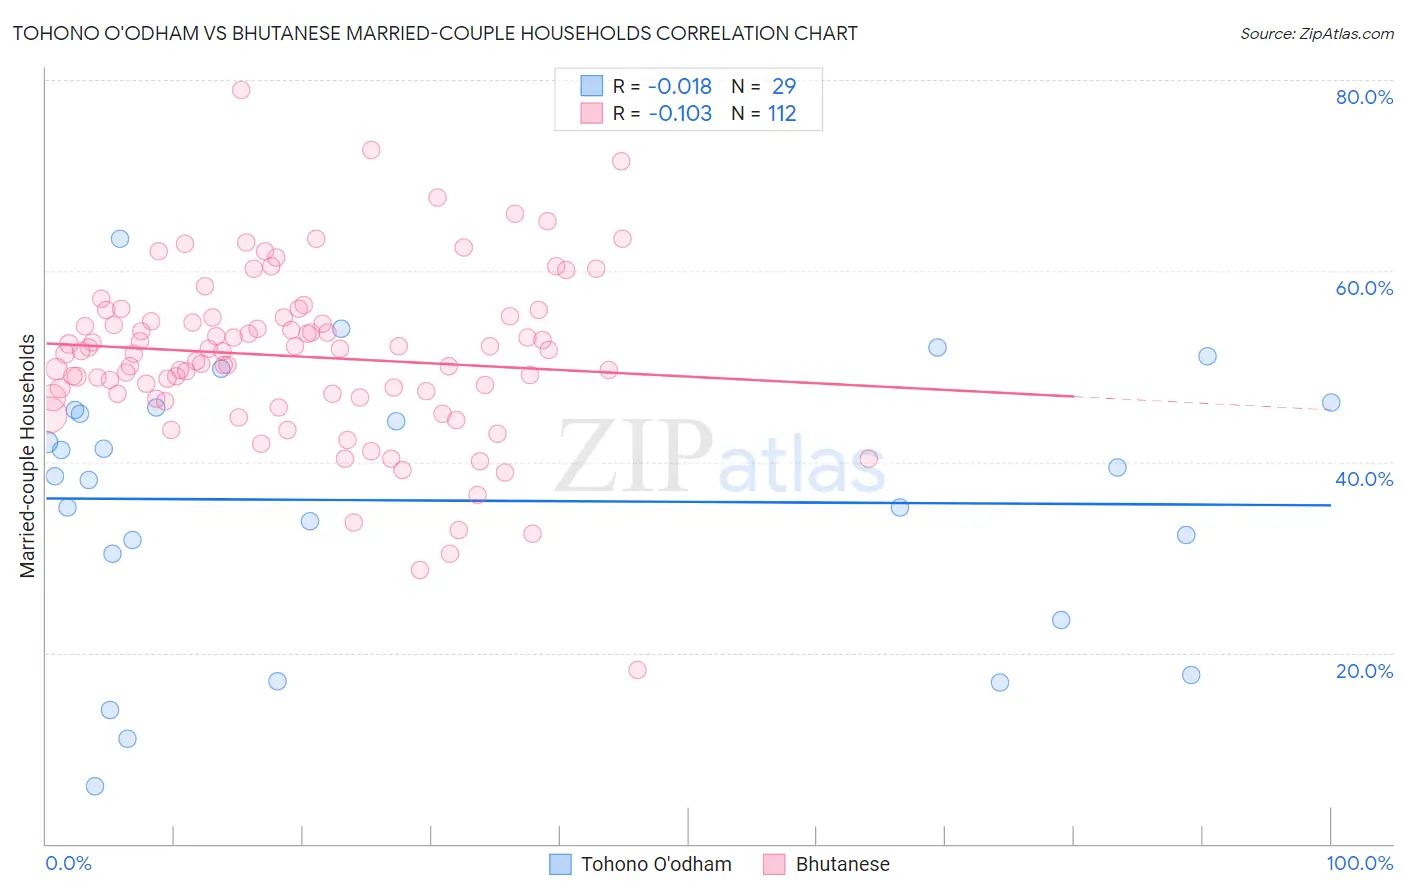
Tohono O'odham vs Bhutanese Married-couple Households Correlation Chart
The statistical analysis conducted on geographies consisting of 58,718,357 people shows no correlation between the proportion of Tohono O'odham and percentage of married-couple family households in the United States with a correlation coefficient (R) of -0.018 and weighted average of 37.9%. Similarly, the statistical analysis conducted on geographies consisting of 455,135,047 people shows a poor negative correlation between the proportion of Bhutanese and percentage of married-couple family households in the United States with a correlation coefficient (R) of -0.103 and weighted average of 49.3%, a difference of 30.0%.
Married-couple Households Correlation Summary
| Measurement | Tohono O'odham | Bhutanese |
| Minimum | 6.1% | 18.2% |
| Maximum | 63.4% | 78.9% |
| Range | 57.3% | 60.7% |
| Mean | 35.9% | 51.0% |
| Median | 38.5% | 51.5% |
| Interquartile 25% (IQ1) | 26.9% | 47.0% |
| Interquartile 75% (IQ3) | 45.6% | 55.1% |
| Interquartile Range (IQR) | 18.7% | 8.1% |
| Standard Deviation (Sample) | 14.1% | 9.0% |
| Standard Deviation (Population) | 13.9% | 9.0% |
Similar Demographics by Married-couple Households
Demographics Similar to Tohono O'odham by Married-couple Households
In terms of married-couple households, the demographic groups most similar to Tohono O'odham are Cape Verdean (38.1%, a difference of 0.60%), Dominican (38.2%, a difference of 0.73%), Immigrants from Grenada (37.5%, a difference of 1.1%), British West Indian (38.3%, a difference of 1.1%), and Immigrants from Senegal (38.4%, a difference of 1.2%).
| Demographics | Rating | Rank | Married-couple Households |
| Immigrants | West Indies | 0.0 /100 | #333 | Tragic 39.0% |
| Immigrants | St. Vincent and the Grenadines | 0.0 /100 | #334 | Tragic 38.7% |
| Senegalese | 0.0 /100 | #335 | Tragic 38.6% |
| Blacks/African Americans | 0.0 /100 | #336 | Tragic 38.5% |
| Immigrants | Somalia | 0.0 /100 | #337 | Tragic 38.4% |
| Immigrants | Senegal | 0.0 /100 | #338 | Tragic 38.4% |
| British West Indians | 0.0 /100 | #339 | Tragic 38.3% |
| Dominicans | 0.0 /100 | #340 | Tragic 38.2% |
| Cape Verdeans | 0.0 /100 | #341 | Tragic 38.1% |
| Tohono O'odham | 0.0 /100 | #342 | Tragic 37.9% |
| Immigrants | Grenada | 0.0 /100 | #343 | Tragic 37.5% |
| Immigrants | Dominican Republic | 0.0 /100 | #344 | Tragic 37.3% |
| Hopi | 0.0 /100 | #345 | Tragic 36.7% |
| Immigrants | Cabo Verde | 0.0 /100 | #346 | Tragic 36.2% |
| Pima | 0.0 /100 | #347 | Tragic 35.6% |
Demographics Similar to Bhutanese by Married-couple Households
In terms of married-couple households, the demographic groups most similar to Bhutanese are Immigrants from Scotland (49.3%, a difference of 0.020%), Immigrants from Philippines (49.3%, a difference of 0.15%), German (49.2%, a difference of 0.19%), Maltese (49.2%, a difference of 0.20%), and Bolivian (49.2%, a difference of 0.21%).
| Demographics | Rating | Rank | Married-couple Households |
| Scandinavians | 99.9 /100 | #20 | Exceptional 49.6% |
| Norwegians | 99.9 /100 | #21 | Exceptional 49.5% |
| Asians | 99.9 /100 | #22 | Exceptional 49.5% |
| Dutch | 99.9 /100 | #23 | Exceptional 49.5% |
| Czechs | 99.9 /100 | #24 | Exceptional 49.4% |
| Immigrants | Philippines | 99.9 /100 | #25 | Exceptional 49.3% |
| Immigrants | Scotland | 99.8 /100 | #26 | Exceptional 49.3% |
| Bhutanese | 99.8 /100 | #27 | Exceptional 49.3% |
| Germans | 99.8 /100 | #28 | Exceptional 49.2% |
| Maltese | 99.8 /100 | #29 | Exceptional 49.2% |
| Bolivians | 99.8 /100 | #30 | Exceptional 49.2% |
| Native Hawaiians | 99.8 /100 | #31 | Exceptional 49.1% |
| Hungarians | 99.8 /100 | #32 | Exceptional 49.1% |
| Immigrants | Asia | 99.7 /100 | #33 | Exceptional 49.1% |
| Italians | 99.7 /100 | #34 | Exceptional 49.0% |