West Indian vs Laotian Family Households
COMPARE
West Indian
Laotian
Family Households
Family Households Comparison
West Indians
Laotians
63.1%
FAMILY HOUSEHOLDS
0.3/ 100
METRIC RATING
275th/ 347
METRIC RANK
65.8%
FAMILY HOUSEHOLDS
99.9/ 100
METRIC RATING
73rd/ 347
METRIC RANK
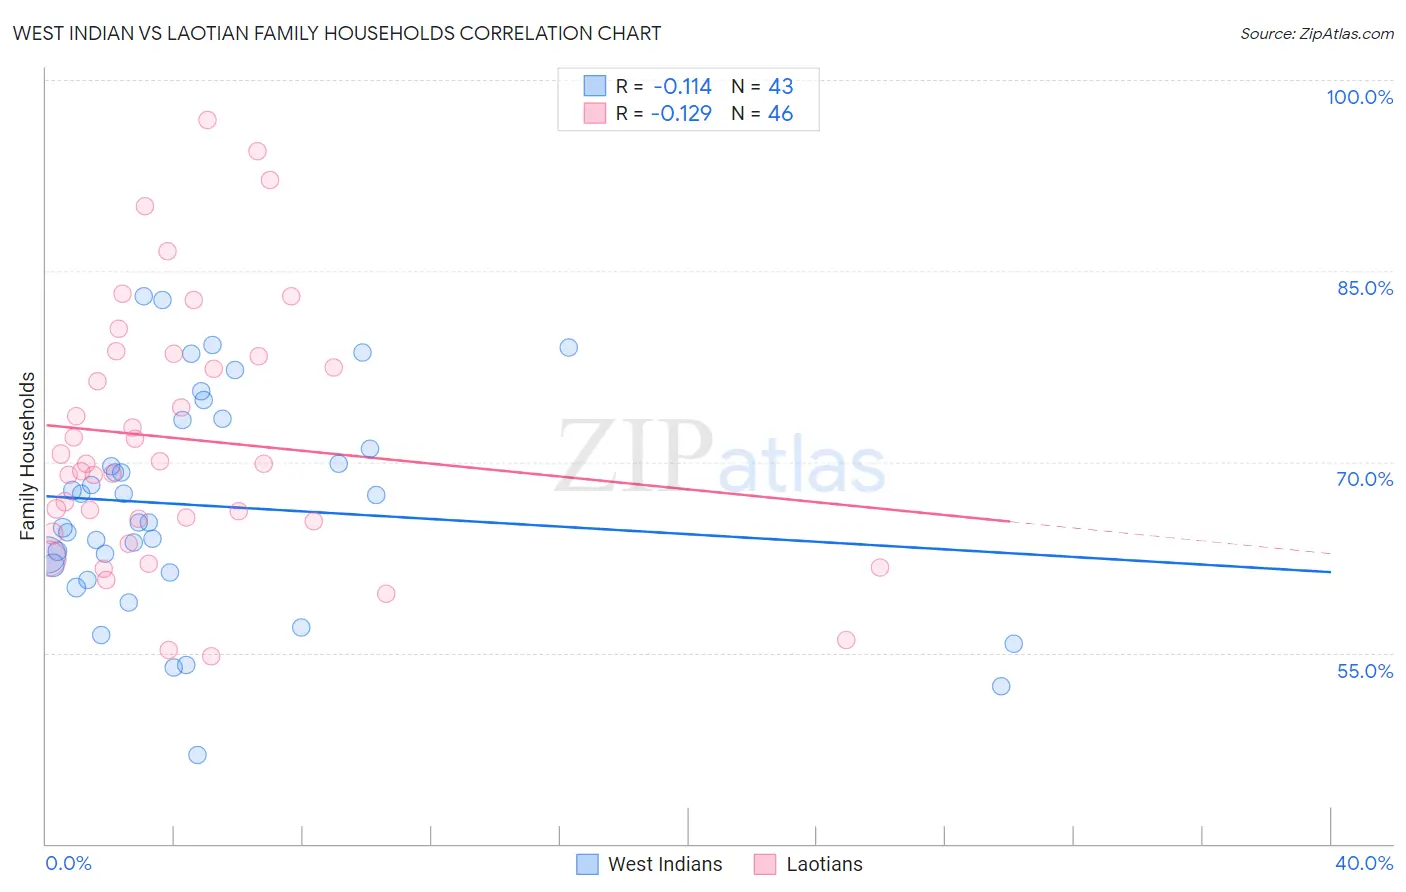
West Indian vs Laotian Family Households Correlation Chart
The statistical analysis conducted on geographies consisting of 253,859,677 people shows a poor negative correlation between the proportion of West Indians and percentage of family households in the United States with a correlation coefficient (R) of -0.114 and weighted average of 63.1%. Similarly, the statistical analysis conducted on geographies consisting of 224,743,344 people shows a poor negative correlation between the proportion of Laotians and percentage of family households in the United States with a correlation coefficient (R) of -0.129 and weighted average of 65.8%, a difference of 4.3%.
Family Households Correlation Summary
| Measurement | West Indian | Laotian |
| Minimum | 47.0% | 54.7% |
| Maximum | 83.0% | 96.9% |
| Range | 36.0% | 42.1% |
| Mean | 66.5% | 71.8% |
| Median | 65.3% | 69.9% |
| Interquartile 25% (IQ1) | 61.3% | 65.4% |
| Interquartile 75% (IQ3) | 73.3% | 78.3% |
| Interquartile Range (IQR) | 12.0% | 12.9% |
| Standard Deviation (Sample) | 8.5% | 10.2% |
| Standard Deviation (Population) | 8.4% | 10.1% |
Similar Demographics by Family Households
Demographics Similar to West Indians by Family Households
In terms of family households, the demographic groups most similar to West Indians are Lumbee (63.1%, a difference of 0.0%), Immigrants from Kazakhstan (63.1%, a difference of 0.010%), Serbian (63.0%, a difference of 0.010%), Immigrants from Croatia (63.1%, a difference of 0.020%), and Immigrants from Turkey (63.1%, a difference of 0.020%).
| Demographics | Rating | Rank | Family Households |
| Immigrants | Singapore | 0.4 /100 | #268 | Tragic 63.1% |
| Yugoslavians | 0.4 /100 | #269 | Tragic 63.1% |
| Immigrants | Austria | 0.3 /100 | #270 | Tragic 63.1% |
| Immigrants | Croatia | 0.3 /100 | #271 | Tragic 63.1% |
| Immigrants | Turkey | 0.3 /100 | #272 | Tragic 63.1% |
| Immigrants | Kazakhstan | 0.3 /100 | #273 | Tragic 63.1% |
| Lumbee | 0.3 /100 | #274 | Tragic 63.1% |
| West Indians | 0.3 /100 | #275 | Tragic 63.1% |
| Serbians | 0.3 /100 | #276 | Tragic 63.0% |
| Ottawa | 0.3 /100 | #277 | Tragic 63.0% |
| Immigrants | Belgium | 0.2 /100 | #278 | Tragic 63.0% |
| Immigrants | Yemen | 0.2 /100 | #279 | Tragic 63.0% |
| Immigrants | Bulgaria | 0.2 /100 | #280 | Tragic 63.0% |
| Estonians | 0.2 /100 | #281 | Tragic 62.9% |
| New Zealanders | 0.1 /100 | #282 | Tragic 62.9% |
Demographics Similar to Laotians by Family Households
In terms of family households, the demographic groups most similar to Laotians are Burmese (65.7%, a difference of 0.040%), Portuguese (65.8%, a difference of 0.080%), Houma (65.7%, a difference of 0.090%), Bhutanese (65.9%, a difference of 0.13%), and Malaysian (65.9%, a difference of 0.15%).
| Demographics | Rating | Rank | Family Households |
| Fijians | 99.9 /100 | #66 | Exceptional 65.9% |
| Filipinos | 99.9 /100 | #67 | Exceptional 65.9% |
| Japanese | 99.9 /100 | #68 | Exceptional 65.9% |
| Malaysians | 99.9 /100 | #69 | Exceptional 65.9% |
| Immigrants | Afghanistan | 99.9 /100 | #70 | Exceptional 65.9% |
| Bhutanese | 99.9 /100 | #71 | Exceptional 65.9% |
| Portuguese | 99.9 /100 | #72 | Exceptional 65.8% |
| Laotians | 99.9 /100 | #73 | Exceptional 65.8% |
| Burmese | 99.9 /100 | #74 | Exceptional 65.7% |
| Houma | 99.9 /100 | #75 | Exceptional 65.7% |
| Immigrants | Azores | 99.8 /100 | #76 | Exceptional 65.6% |
| Immigrants | South America | 99.8 /100 | #77 | Exceptional 65.6% |
| Yaqui | 99.8 /100 | #78 | Exceptional 65.6% |
| Immigrants | Costa Rica | 99.8 /100 | #79 | Exceptional 65.6% |
| Puget Sound Salish | 99.8 /100 | #80 | Exceptional 65.6% |