Crow vs Laotian Family Households
COMPARE
Crow
Laotian
Family Households
Family Households Comparison
Crow
Laotians
65.3%
FAMILY HOUSEHOLDS
98.9/ 100
METRIC RATING
91st/ 347
METRIC RANK
65.8%
FAMILY HOUSEHOLDS
99.9/ 100
METRIC RATING
73rd/ 347
METRIC RANK
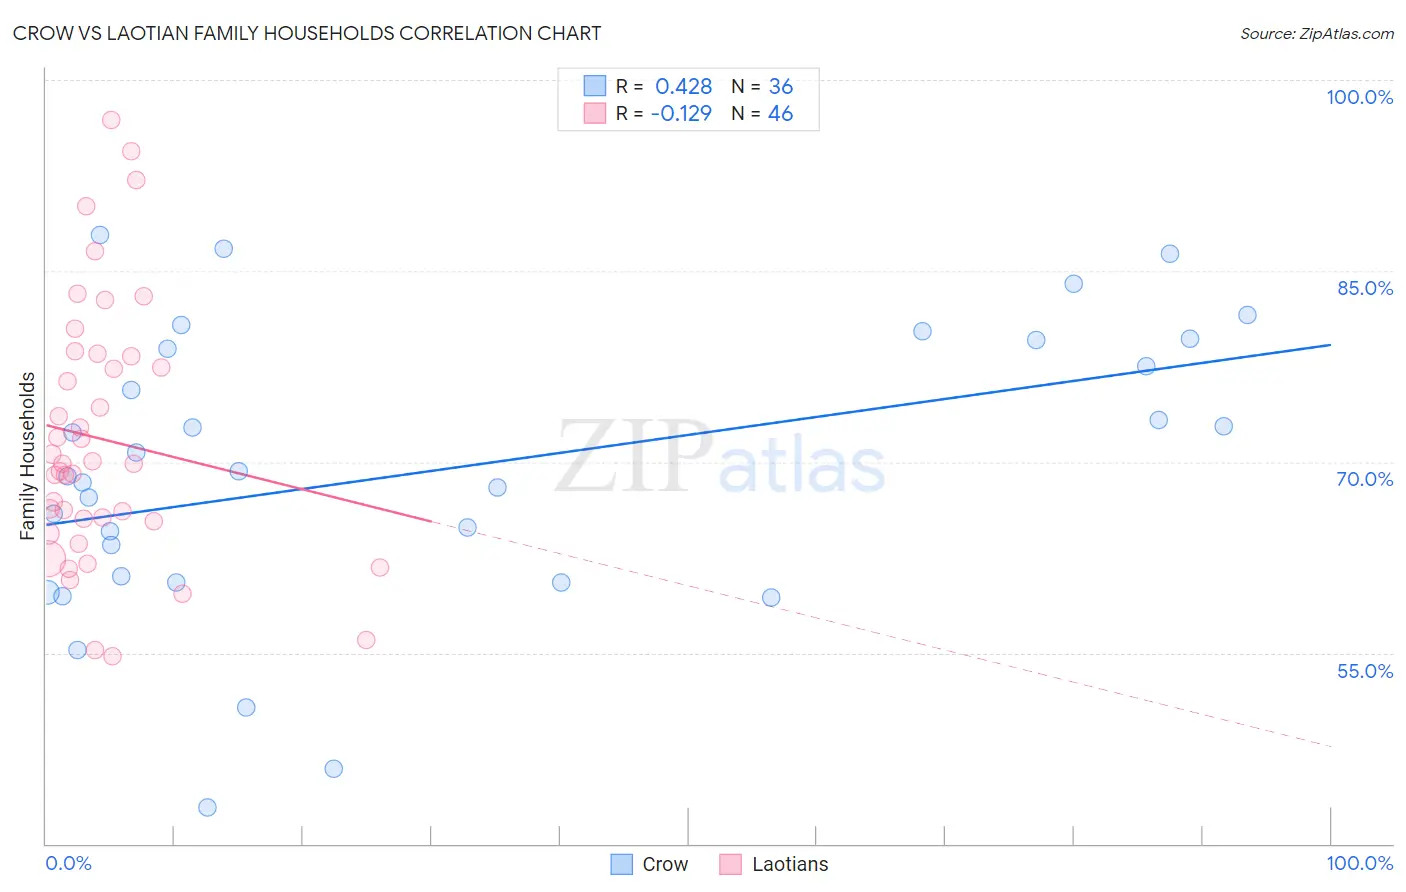
Crow vs Laotian Family Households Correlation Chart
The statistical analysis conducted on geographies consisting of 59,202,817 people shows a moderate positive correlation between the proportion of Crow and percentage of family households in the United States with a correlation coefficient (R) of 0.428 and weighted average of 65.3%. Similarly, the statistical analysis conducted on geographies consisting of 224,743,344 people shows a poor negative correlation between the proportion of Laotians and percentage of family households in the United States with a correlation coefficient (R) of -0.129 and weighted average of 65.8%, a difference of 0.75%.
Family Households Correlation Summary
| Measurement | Crow | Laotian |
| Minimum | 42.9% | 54.7% |
| Maximum | 87.9% | 96.9% |
| Range | 45.0% | 42.1% |
| Mean | 69.3% | 71.8% |
| Median | 69.0% | 69.9% |
| Interquartile 25% (IQ1) | 60.8% | 65.4% |
| Interquartile 75% (IQ3) | 79.2% | 78.3% |
| Interquartile Range (IQR) | 18.4% | 12.9% |
| Standard Deviation (Sample) | 11.2% | 10.2% |
| Standard Deviation (Population) | 11.1% | 10.1% |
Demographics Similar to Crow and Laotians by Family Households
In terms of family households, the demographic groups most similar to Crow are Hopi (65.3%, a difference of 0.040%), Immigrants from Laos (65.3%, a difference of 0.050%), Immigrants from Caribbean (65.3%, a difference of 0.060%), Immigrants from Haiti (65.3%, a difference of 0.070%), and Immigrants from Egypt (65.3%, a difference of 0.10%). Similarly, the demographic groups most similar to Laotians are Burmese (65.7%, a difference of 0.040%), Portuguese (65.8%, a difference of 0.080%), Houma (65.7%, a difference of 0.090%), Immigrants from the Azores (65.6%, a difference of 0.20%), and Immigrants from South America (65.6%, a difference of 0.21%).
| Demographics | Rating | Rank | Family Households |
| Portuguese | 99.9 /100 | #72 | Exceptional 65.8% |
| Laotians | 99.9 /100 | #73 | Exceptional 65.8% |
| Burmese | 99.9 /100 | #74 | Exceptional 65.7% |
| Houma | 99.9 /100 | #75 | Exceptional 65.7% |
| Immigrants | Azores | 99.8 /100 | #76 | Exceptional 65.6% |
| Immigrants | South America | 99.8 /100 | #77 | Exceptional 65.6% |
| Yaqui | 99.8 /100 | #78 | Exceptional 65.6% |
| Immigrants | Costa Rica | 99.8 /100 | #79 | Exceptional 65.6% |
| Puget Sound Salish | 99.8 /100 | #80 | Exceptional 65.6% |
| Jordanians | 99.7 /100 | #81 | Exceptional 65.5% |
| Immigrants | Lebanon | 99.7 /100 | #82 | Exceptional 65.5% |
| Immigrants | Guyana | 99.6 /100 | #83 | Exceptional 65.5% |
| Americans | 99.6 /100 | #84 | Exceptional 65.5% |
| Immigrants | Cambodia | 99.5 /100 | #85 | Exceptional 65.4% |
| Egyptians | 99.4 /100 | #86 | Exceptional 65.4% |
| Immigrants | Egypt | 99.2 /100 | #87 | Exceptional 65.3% |
| Immigrants | Haiti | 99.1 /100 | #88 | Exceptional 65.3% |
| Immigrants | Caribbean | 99.1 /100 | #89 | Exceptional 65.3% |
| Immigrants | Laos | 99.1 /100 | #90 | Exceptional 65.3% |
| Crow | 98.9 /100 | #91 | Exceptional 65.3% |
| Hopi | 98.8 /100 | #92 | Exceptional 65.3% |