Subsaharan African vs Iroquois Average Family Size
COMPARE
Subsaharan African
Iroquois
Average Family Size
Average Family Size Comparison
Sub-Saharan Africans
Iroquois
3.25
AVERAGE FAMILY SIZE
81.6/ 100
METRIC RATING
140th/ 347
METRIC RANK
3.16
AVERAGE FAMILY SIZE
0.8/ 100
METRIC RATING
267th/ 347
METRIC RANK
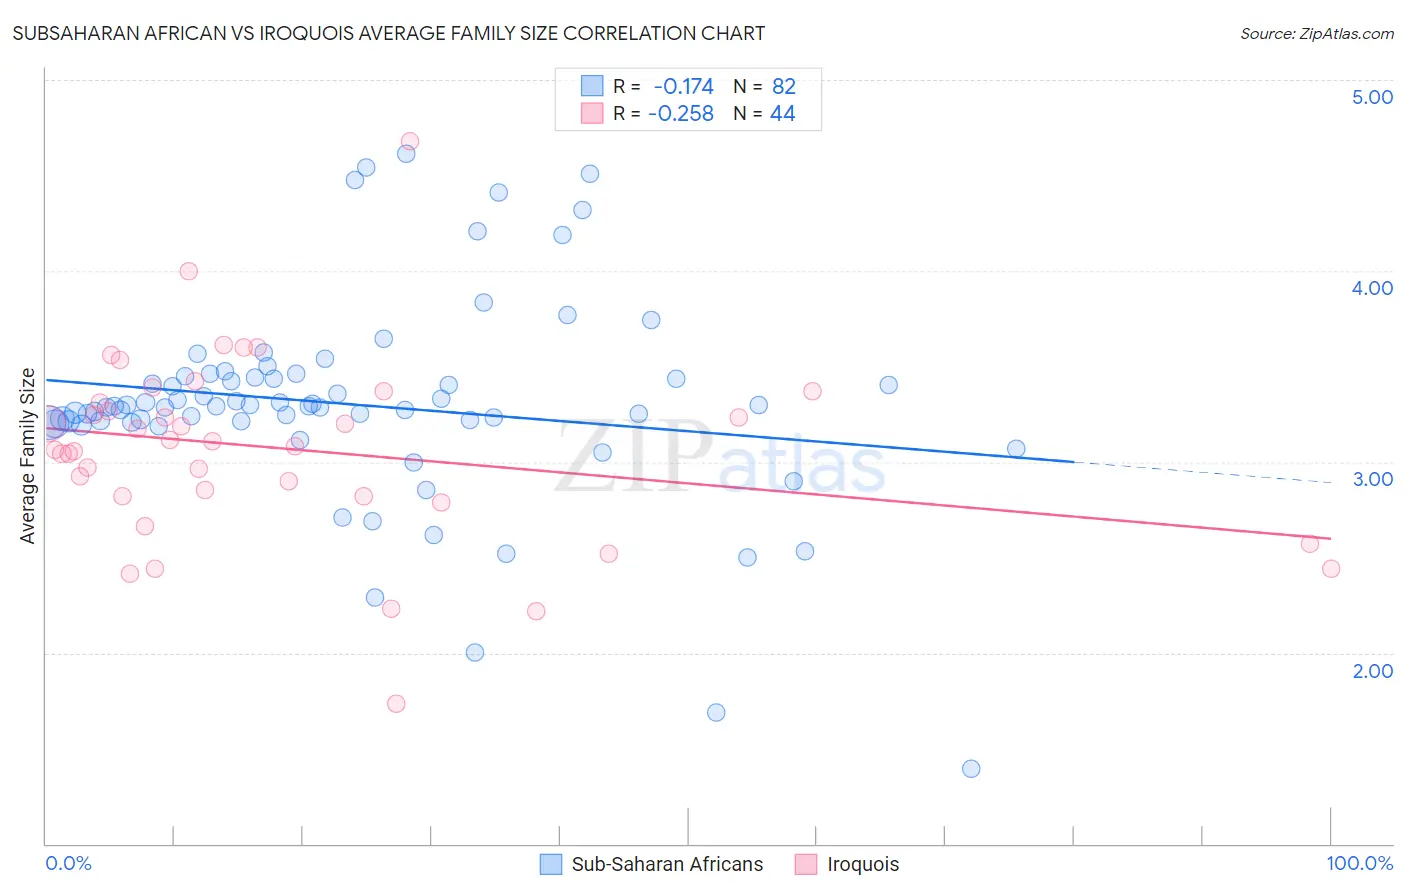
Subsaharan African vs Iroquois Average Family Size Correlation Chart
The statistical analysis conducted on geographies consisting of 507,604,346 people shows a poor negative correlation between the proportion of Sub-Saharan Africans and average family size in the United States with a correlation coefficient (R) of -0.174 and weighted average of 3.25. Similarly, the statistical analysis conducted on geographies consisting of 207,249,368 people shows a weak negative correlation between the proportion of Iroquois and average family size in the United States with a correlation coefficient (R) of -0.258 and weighted average of 3.16, a difference of 2.9%.
Average Family Size Correlation Summary
| Measurement | Subsaharan African | Iroquois |
| Minimum | 1.39 | 1.73 |
| Maximum | 4.61 | 4.68 |
| Range | 3.22 | 2.95 |
| Mean | 3.30 | 3.07 |
| Median | 3.29 | 3.10 |
| Interquartile 25% (IQ1) | 3.21 | 2.82 |
| Interquartile 75% (IQ3) | 3.44 | 3.34 |
| Interquartile Range (IQR) | 0.23 | 0.52 |
| Standard Deviation (Sample) | 0.54 | 0.50 |
| Standard Deviation (Population) | 0.54 | 0.50 |
Similar Demographics by Average Family Size
Demographics Similar to Sub-Saharan Africans by Average Family Size
In terms of average family size, the demographic groups most similar to Sub-Saharan Africans are Immigrants from Ethiopia (3.25, a difference of 0.0%), Venezuelan (3.25, a difference of 0.0%), Cuban (3.25, a difference of 0.010%), Liberian (3.25, a difference of 0.010%), and Immigrants from Middle Africa (3.25, a difference of 0.020%).
| Demographics | Rating | Rank | Average Family Size |
| Immigrants | Venezuela | 86.3 /100 | #133 | Excellent 3.26 |
| Africans | 84.9 /100 | #134 | Excellent 3.25 |
| Panamanians | 84.2 /100 | #135 | Excellent 3.25 |
| Comanche | 82.8 /100 | #136 | Excellent 3.25 |
| Immigrants | Middle Africa | 82.4 /100 | #137 | Excellent 3.25 |
| Cubans | 81.8 /100 | #138 | Excellent 3.25 |
| Immigrants | Ethiopia | 81.6 /100 | #139 | Excellent 3.25 |
| Sub-Saharan Africans | 81.6 /100 | #140 | Excellent 3.25 |
| Venezuelans | 81.4 /100 | #141 | Excellent 3.25 |
| Liberians | 81.2 /100 | #142 | Excellent 3.25 |
| Bhutanese | 81.0 /100 | #143 | Excellent 3.25 |
| Tsimshian | 80.2 /100 | #144 | Excellent 3.25 |
| Armenians | 78.2 /100 | #145 | Good 3.25 |
| Immigrants | Africa | 77.9 /100 | #146 | Good 3.25 |
| Immigrants | Jordan | 75.7 /100 | #147 | Good 3.24 |
Demographics Similar to Iroquois by Average Family Size
In terms of average family size, the demographic groups most similar to Iroquois are Immigrants from Greece (3.16, a difference of 0.020%), Immigrants from South Africa (3.16, a difference of 0.030%), Maltese (3.16, a difference of 0.040%), Immigrants from Singapore (3.16, a difference of 0.050%), and American (3.16, a difference of 0.080%).
| Demographics | Rating | Rank | Average Family Size |
| Immigrants | Albania | 1.3 /100 | #260 | Tragic 3.16 |
| Immigrants | North Macedonia | 1.3 /100 | #261 | Tragic 3.16 |
| Immigrants | Russia | 1.3 /100 | #262 | Tragic 3.16 |
| Immigrants | Bulgaria | 1.0 /100 | #263 | Tragic 3.16 |
| Americans | 1.0 /100 | #264 | Tragic 3.16 |
| Immigrants | South Africa | 0.9 /100 | #265 | Tragic 3.16 |
| Immigrants | Greece | 0.9 /100 | #266 | Tragic 3.16 |
| Iroquois | 0.8 /100 | #267 | Tragic 3.16 |
| Maltese | 0.8 /100 | #268 | Tragic 3.16 |
| Immigrants | Singapore | 0.7 /100 | #269 | Tragic 3.16 |
| Tlingit-Haida | 0.7 /100 | #270 | Tragic 3.16 |
| Immigrants | Germany | 0.7 /100 | #271 | Tragic 3.15 |
| Immigrants | Lithuania | 0.6 /100 | #272 | Tragic 3.15 |
| New Zealanders | 0.6 /100 | #273 | Tragic 3.15 |
| Immigrants | Belgium | 0.6 /100 | #274 | Tragic 3.15 |