Subsaharan African vs Immigrants from Oceania Average Family Size
COMPARE
Subsaharan African
Immigrants from Oceania
Average Family Size
Average Family Size Comparison
Sub-Saharan Africans
Immigrants from Oceania
3.25
AVERAGE FAMILY SIZE
81.6/ 100
METRIC RATING
140th/ 347
METRIC RANK
3.29
AVERAGE FAMILY SIZE
98.7/ 100
METRIC RATING
97th/ 347
METRIC RANK
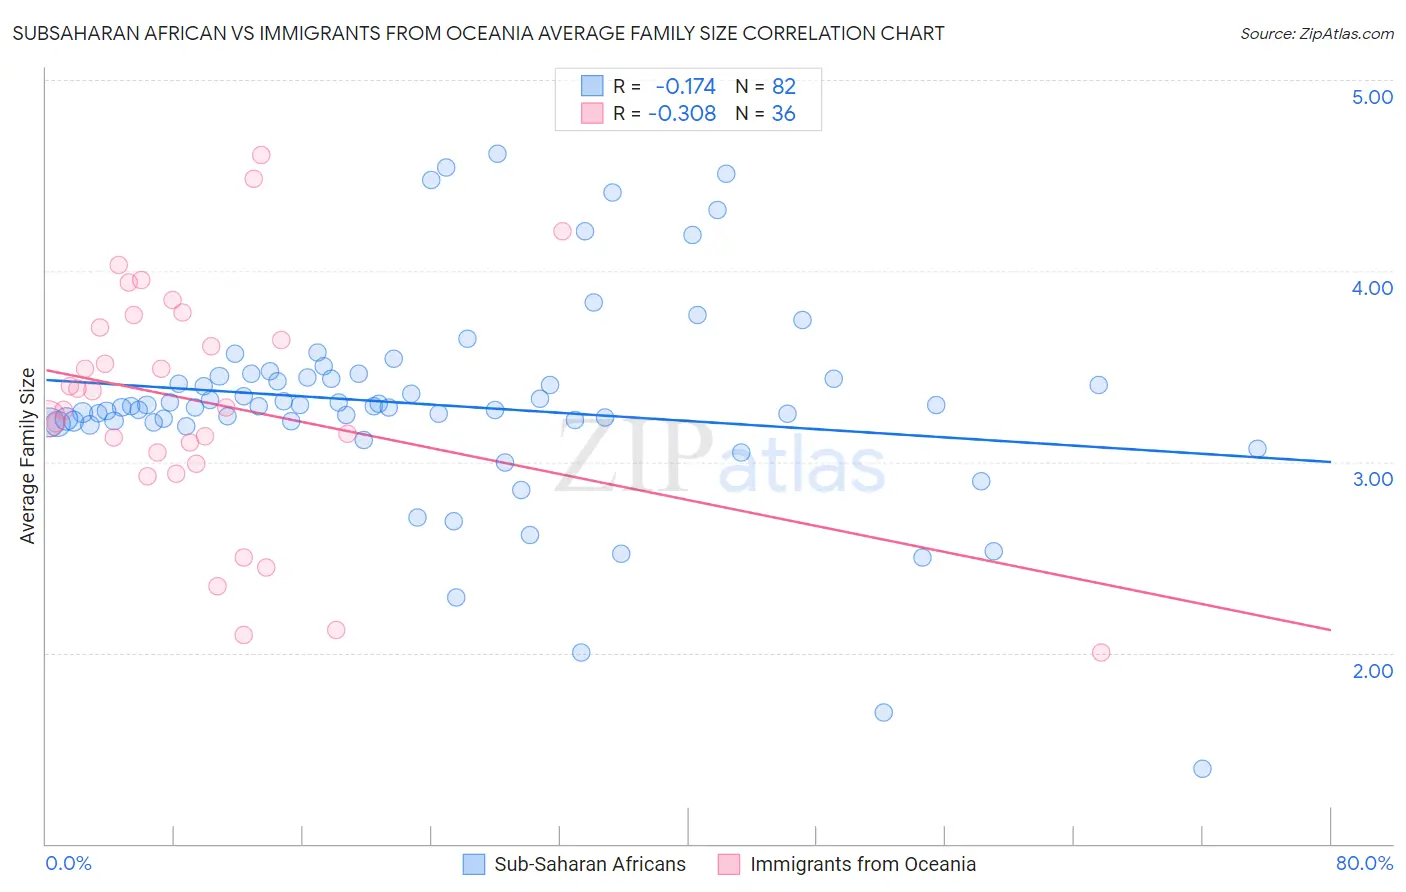
Subsaharan African vs Immigrants from Oceania Average Family Size Correlation Chart
The statistical analysis conducted on geographies consisting of 507,604,346 people shows a poor negative correlation between the proportion of Sub-Saharan Africans and average family size in the United States with a correlation coefficient (R) of -0.174 and weighted average of 3.25. Similarly, the statistical analysis conducted on geographies consisting of 305,389,085 people shows a mild negative correlation between the proportion of Immigrants from Oceania and average family size in the United States with a correlation coefficient (R) of -0.308 and weighted average of 3.29, a difference of 1.3%.
Average Family Size Correlation Summary
| Measurement | Subsaharan African | Immigrants from Oceania |
| Minimum | 1.39 | 2.00 |
| Maximum | 4.61 | 4.61 |
| Range | 3.22 | 2.61 |
| Mean | 3.30 | 3.31 |
| Median | 3.29 | 3.33 |
| Interquartile 25% (IQ1) | 3.21 | 3.02 |
| Interquartile 75% (IQ3) | 3.44 | 3.74 |
| Interquartile Range (IQR) | 0.23 | 0.71 |
| Standard Deviation (Sample) | 0.54 | 0.63 |
| Standard Deviation (Population) | 0.54 | 0.62 |
Similar Demographics by Average Family Size
Demographics Similar to Sub-Saharan Africans by Average Family Size
In terms of average family size, the demographic groups most similar to Sub-Saharan Africans are Immigrants from Ethiopia (3.25, a difference of 0.0%), Venezuelan (3.25, a difference of 0.0%), Cuban (3.25, a difference of 0.010%), Liberian (3.25, a difference of 0.010%), and Immigrants from Middle Africa (3.25, a difference of 0.020%).
| Demographics | Rating | Rank | Average Family Size |
| Immigrants | Venezuela | 86.3 /100 | #133 | Excellent 3.26 |
| Africans | 84.9 /100 | #134 | Excellent 3.25 |
| Panamanians | 84.2 /100 | #135 | Excellent 3.25 |
| Comanche | 82.8 /100 | #136 | Excellent 3.25 |
| Immigrants | Middle Africa | 82.4 /100 | #137 | Excellent 3.25 |
| Cubans | 81.8 /100 | #138 | Excellent 3.25 |
| Immigrants | Ethiopia | 81.6 /100 | #139 | Excellent 3.25 |
| Sub-Saharan Africans | 81.6 /100 | #140 | Excellent 3.25 |
| Venezuelans | 81.4 /100 | #141 | Excellent 3.25 |
| Liberians | 81.2 /100 | #142 | Excellent 3.25 |
| Bhutanese | 81.0 /100 | #143 | Excellent 3.25 |
| Tsimshian | 80.2 /100 | #144 | Excellent 3.25 |
| Armenians | 78.2 /100 | #145 | Good 3.25 |
| Immigrants | Africa | 77.9 /100 | #146 | Good 3.25 |
| Immigrants | Jordan | 75.7 /100 | #147 | Good 3.24 |
Demographics Similar to Immigrants from Oceania by Average Family Size
In terms of average family size, the demographic groups most similar to Immigrants from Oceania are Barbadian (3.29, a difference of 0.0%), Nigerian (3.29, a difference of 0.010%), Guamanian/Chamorro (3.29, a difference of 0.010%), Immigrants from Burma/Myanmar (3.29, a difference of 0.030%), and U.S. Virgin Islander (3.29, a difference of 0.040%).
| Demographics | Rating | Rank | Average Family Size |
| Menominee | 99.4 /100 | #90 | Exceptional 3.30 |
| Immigrants | Pakistan | 99.2 /100 | #91 | Exceptional 3.30 |
| Immigrants | Cameroon | 99.2 /100 | #92 | Exceptional 3.30 |
| Peruvians | 99.2 /100 | #93 | Exceptional 3.30 |
| Sierra Leoneans | 99.0 /100 | #94 | Exceptional 3.30 |
| Immigrants | Lebanon | 99.0 /100 | #95 | Exceptional 3.30 |
| U.S. Virgin Islanders | 98.8 /100 | #96 | Exceptional 3.29 |
| Immigrants | Oceania | 98.7 /100 | #97 | Exceptional 3.29 |
| Barbadians | 98.6 /100 | #98 | Exceptional 3.29 |
| Nigerians | 98.6 /100 | #99 | Exceptional 3.29 |
| Guamanians/Chamorros | 98.6 /100 | #100 | Exceptional 3.29 |
| Immigrants | Burma/Myanmar | 98.6 /100 | #101 | Exceptional 3.29 |
| West Indians | 98.5 /100 | #102 | Exceptional 3.29 |
| Immigrants | Western Africa | 98.4 /100 | #103 | Exceptional 3.29 |
| Bolivians | 98.3 /100 | #104 | Exceptional 3.29 |