Subsaharan African vs Immigrants from Sierra Leone Average Family Size
COMPARE
Subsaharan African
Immigrants from Sierra Leone
Average Family Size
Average Family Size Comparison
Sub-Saharan Africans
Immigrants from Sierra Leone
3.25
AVERAGE FAMILY SIZE
81.6/ 100
METRIC RATING
140th/ 347
METRIC RANK
3.32
AVERAGE FAMILY SIZE
99.9/ 100
METRIC RATING
74th/ 347
METRIC RANK
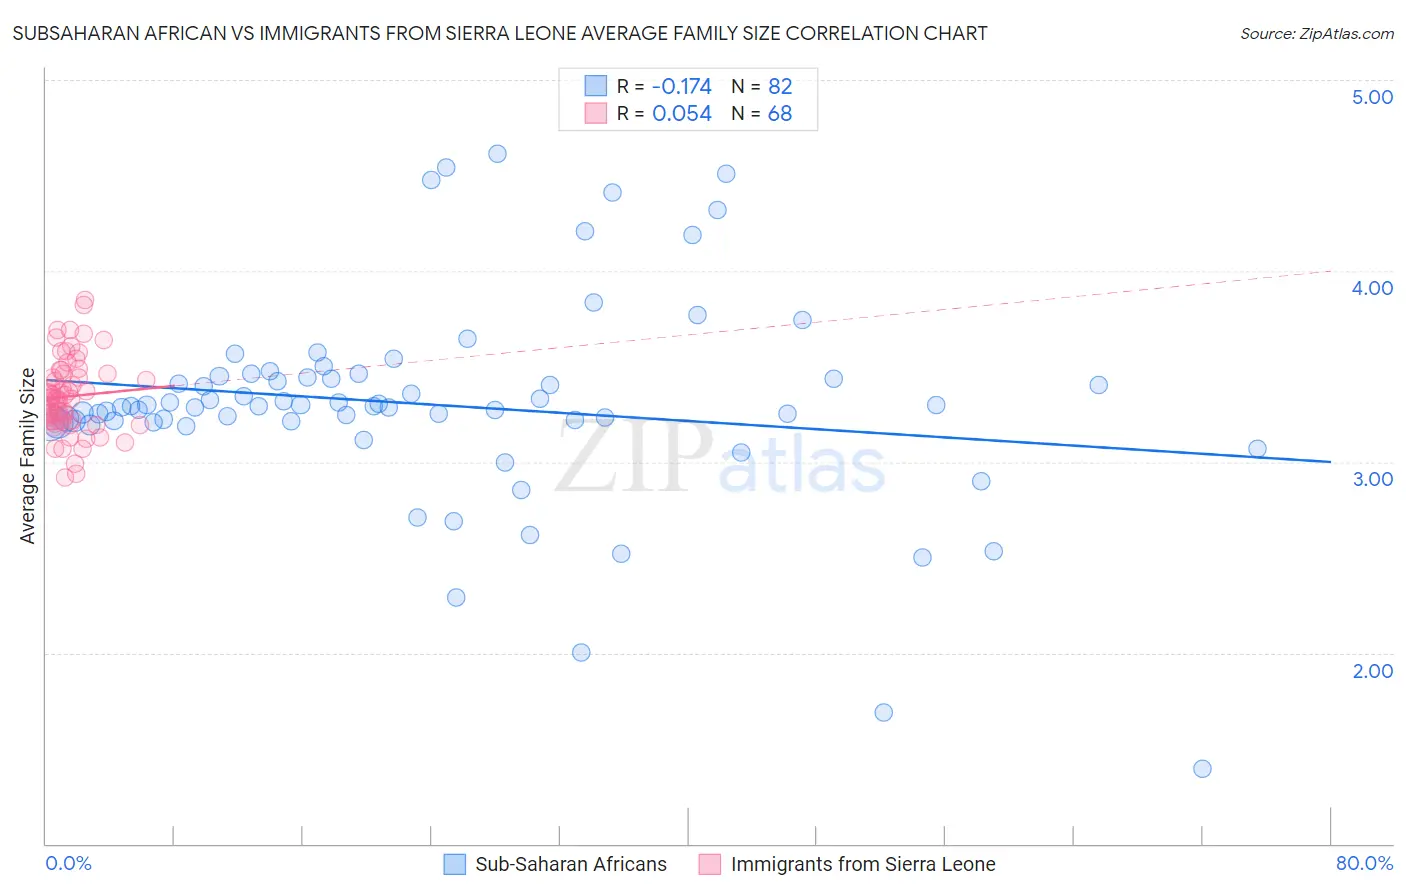
Subsaharan African vs Immigrants from Sierra Leone Average Family Size Correlation Chart
The statistical analysis conducted on geographies consisting of 507,604,346 people shows a poor negative correlation between the proportion of Sub-Saharan Africans and average family size in the United States with a correlation coefficient (R) of -0.174 and weighted average of 3.25. Similarly, the statistical analysis conducted on geographies consisting of 101,646,973 people shows a slight positive correlation between the proportion of Immigrants from Sierra Leone and average family size in the United States with a correlation coefficient (R) of 0.054 and weighted average of 3.32, a difference of 2.3%.
Average Family Size Correlation Summary
| Measurement | Subsaharan African | Immigrants from Sierra Leone |
| Minimum | 1.39 | 2.92 |
| Maximum | 4.61 | 3.85 |
| Range | 3.22 | 0.93 |
| Mean | 3.30 | 3.34 |
| Median | 3.29 | 3.33 |
| Interquartile 25% (IQ1) | 3.21 | 3.21 |
| Interquartile 75% (IQ3) | 3.44 | 3.46 |
| Interquartile Range (IQR) | 0.23 | 0.25 |
| Standard Deviation (Sample) | 0.54 | 0.20 |
| Standard Deviation (Population) | 0.54 | 0.20 |
Similar Demographics by Average Family Size
Demographics Similar to Sub-Saharan Africans by Average Family Size
In terms of average family size, the demographic groups most similar to Sub-Saharan Africans are Immigrants from Ethiopia (3.25, a difference of 0.0%), Venezuelan (3.25, a difference of 0.0%), Cuban (3.25, a difference of 0.010%), Liberian (3.25, a difference of 0.010%), and Immigrants from Middle Africa (3.25, a difference of 0.020%).
| Demographics | Rating | Rank | Average Family Size |
| Immigrants | Venezuela | 86.3 /100 | #133 | Excellent 3.26 |
| Africans | 84.9 /100 | #134 | Excellent 3.25 |
| Panamanians | 84.2 /100 | #135 | Excellent 3.25 |
| Comanche | 82.8 /100 | #136 | Excellent 3.25 |
| Immigrants | Middle Africa | 82.4 /100 | #137 | Excellent 3.25 |
| Cubans | 81.8 /100 | #138 | Excellent 3.25 |
| Immigrants | Ethiopia | 81.6 /100 | #139 | Excellent 3.25 |
| Sub-Saharan Africans | 81.6 /100 | #140 | Excellent 3.25 |
| Venezuelans | 81.4 /100 | #141 | Excellent 3.25 |
| Liberians | 81.2 /100 | #142 | Excellent 3.25 |
| Bhutanese | 81.0 /100 | #143 | Excellent 3.25 |
| Tsimshian | 80.2 /100 | #144 | Excellent 3.25 |
| Armenians | 78.2 /100 | #145 | Good 3.25 |
| Immigrants | Africa | 77.9 /100 | #146 | Good 3.25 |
| Immigrants | Jordan | 75.7 /100 | #147 | Good 3.24 |
Demographics Similar to Immigrants from Sierra Leone by Average Family Size
In terms of average family size, the demographic groups most similar to Immigrants from Sierra Leone are Yaqui (3.32, a difference of 0.030%), Immigrants from Barbados (3.32, a difference of 0.030%), Immigrants from Caribbean (3.33, a difference of 0.050%), Trinidadian and Tobagonian (3.32, a difference of 0.050%), and Immigrants from Ecuador (3.32, a difference of 0.060%).
| Demographics | Rating | Rank | Average Family Size |
| Immigrants | Jamaica | 99.9 /100 | #67 | Exceptional 3.33 |
| Immigrants | Cambodia | 99.9 /100 | #68 | Exceptional 3.33 |
| Immigrants | Immigrants | 99.9 /100 | #69 | Exceptional 3.33 |
| Immigrants | Trinidad and Tobago | 99.9 /100 | #70 | Exceptional 3.33 |
| Immigrants | West Indies | 99.9 /100 | #71 | Exceptional 3.33 |
| Immigrants | Caribbean | 99.9 /100 | #72 | Exceptional 3.33 |
| Yaqui | 99.9 /100 | #73 | Exceptional 3.32 |
| Immigrants | Sierra Leone | 99.9 /100 | #74 | Exceptional 3.32 |
| Immigrants | Barbados | 99.8 /100 | #75 | Exceptional 3.32 |
| Trinidadians and Tobagonians | 99.8 /100 | #76 | Exceptional 3.32 |
| Immigrants | Ecuador | 99.8 /100 | #77 | Exceptional 3.32 |
| Immigrants | Micronesia | 99.8 /100 | #78 | Exceptional 3.32 |
| British West Indians | 99.8 /100 | #79 | Exceptional 3.32 |
| Lumbee | 99.8 /100 | #80 | Exceptional 3.32 |
| Immigrants | Dominica | 99.8 /100 | #81 | Exceptional 3.32 |