Subsaharan African vs Iroquois Householder Income Over 65 years
COMPARE
Subsaharan African
Iroquois
Householder Income Over 65 years
Householder Income Over 65 years Comparison
Sub-Saharan Africans
Iroquois
$56,615
HOUSEHOLDER INCOME OVER 65 YEARS
1.0/ 100
METRIC RATING
240th/ 347
METRIC RANK
$53,737
HOUSEHOLDER INCOME OVER 65 YEARS
0.1/ 100
METRIC RATING
289th/ 347
METRIC RANK
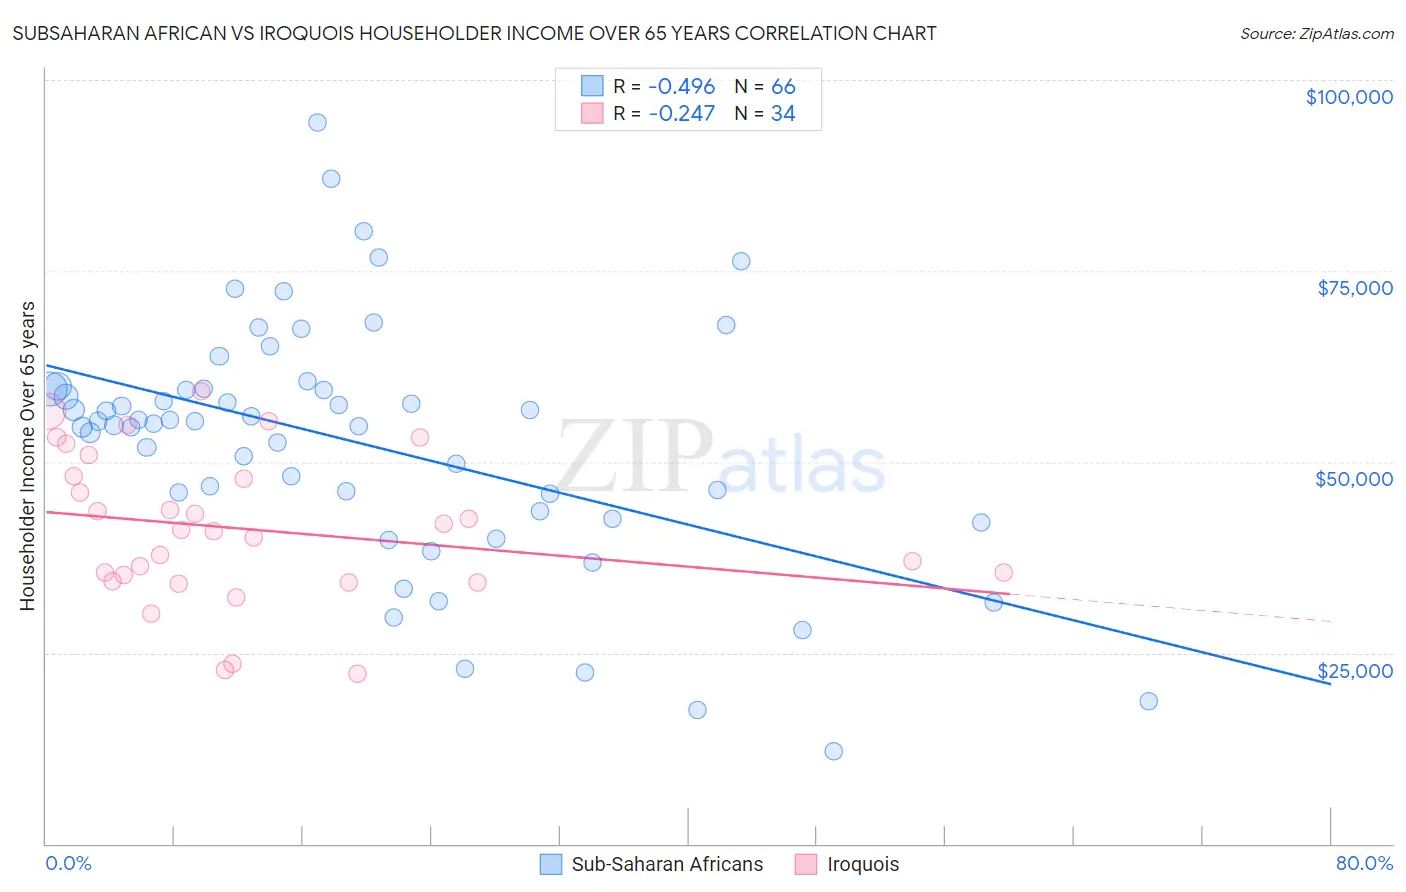
Subsaharan African vs Iroquois Householder Income Over 65 years Correlation Chart
The statistical analysis conducted on geographies consisting of 505,008,485 people shows a moderate negative correlation between the proportion of Sub-Saharan Africans and household income with householder over the age of 65 in the United States with a correlation coefficient (R) of -0.496 and weighted average of $56,615. Similarly, the statistical analysis conducted on geographies consisting of 206,830,612 people shows a weak negative correlation between the proportion of Iroquois and household income with householder over the age of 65 in the United States with a correlation coefficient (R) of -0.247 and weighted average of $53,737, a difference of 5.4%.
Householder Income Over 65 years Correlation Summary
| Measurement | Subsaharan African | Iroquois |
| Minimum | $12,049 | $22,212 |
| Maximum | $94,427 | $59,317 |
| Range | $82,378 | $37,105 |
| Mean | $52,341 | $41,171 |
| Median | $55,146 | $40,975 |
| Interquartile 25% (IQ1) | $43,507 | $34,309 |
| Interquartile 75% (IQ3) | $59,521 | $48,128 |
| Interquartile Range (IQR) | $16,014 | $13,819 |
| Standard Deviation (Sample) | $16,149 | $9,770 |
| Standard Deviation (Population) | $16,026 | $9,625 |
Similar Demographics by Householder Income Over 65 years
Demographics Similar to Sub-Saharan Africans by Householder Income Over 65 years
In terms of householder income over 65 years, the demographic groups most similar to Sub-Saharan Africans are Immigrants from Laos ($56,722, a difference of 0.19%), Immigrants from Guyana ($56,495, a difference of 0.21%), Fijian ($56,768, a difference of 0.27%), Yaqui ($56,417, a difference of 0.35%), and Guyanese ($56,351, a difference of 0.47%).
| Demographics | Rating | Rank | Householder Income Over 65 years |
| Immigrants | Western Africa | 1.7 /100 | #233 | Tragic $57,119 |
| Immigrants | Burma/Myanmar | 1.7 /100 | #234 | Tragic $57,114 |
| Spanish Americans | 1.6 /100 | #235 | Tragic $57,021 |
| Immigrants | Uruguay | 1.5 /100 | #236 | Tragic $56,975 |
| Immigrants | Panama | 1.5 /100 | #237 | Tragic $56,944 |
| Fijians | 1.2 /100 | #238 | Tragic $56,768 |
| Immigrants | Laos | 1.2 /100 | #239 | Tragic $56,722 |
| Sub-Saharan Africans | 1.0 /100 | #240 | Tragic $56,615 |
| Immigrants | Guyana | 0.9 /100 | #241 | Tragic $56,495 |
| Yaqui | 0.8 /100 | #242 | Tragic $56,417 |
| Guyanese | 0.8 /100 | #243 | Tragic $56,351 |
| Hmong | 0.8 /100 | #244 | Tragic $56,339 |
| Immigrants | Uzbekistan | 0.8 /100 | #245 | Tragic $56,331 |
| Central Americans | 0.8 /100 | #246 | Tragic $56,321 |
| Yakama | 0.7 /100 | #247 | Tragic $56,234 |
Demographics Similar to Iroquois by Householder Income Over 65 years
In terms of householder income over 65 years, the demographic groups most similar to Iroquois are Chickasaw ($53,732, a difference of 0.010%), Immigrants from Barbados ($53,766, a difference of 0.050%), Paiute ($53,762, a difference of 0.050%), African ($53,711, a difference of 0.050%), and Shoshone ($53,681, a difference of 0.10%).
| Demographics | Rating | Rank | Householder Income Over 65 years |
| Immigrants | Armenia | 0.1 /100 | #282 | Tragic $53,974 |
| Immigrants | Liberia | 0.1 /100 | #283 | Tragic $53,967 |
| Immigrants | Guatemala | 0.1 /100 | #284 | Tragic $53,950 |
| Mexicans | 0.1 /100 | #285 | Tragic $53,897 |
| Chippewa | 0.1 /100 | #286 | Tragic $53,847 |
| Immigrants | Barbados | 0.1 /100 | #287 | Tragic $53,766 |
| Paiute | 0.1 /100 | #288 | Tragic $53,762 |
| Iroquois | 0.1 /100 | #289 | Tragic $53,737 |
| Chickasaw | 0.1 /100 | #290 | Tragic $53,732 |
| Africans | 0.0 /100 | #291 | Tragic $53,711 |
| Shoshone | 0.0 /100 | #292 | Tragic $53,681 |
| Immigrants | Belize | 0.0 /100 | #293 | Tragic $53,665 |
| Senegalese | 0.0 /100 | #294 | Tragic $53,591 |
| Immigrants | Central America | 0.0 /100 | #295 | Tragic $53,420 |
| Immigrants | Somalia | 0.0 /100 | #296 | Tragic $53,333 |