Immigrants from Bulgaria vs Iroquois Average Family Size
COMPARE
Immigrants from Bulgaria
Iroquois
Average Family Size
Average Family Size Comparison
Immigrants from Bulgaria
Iroquois
3.16
AVERAGE FAMILY SIZE
1.0/ 100
METRIC RATING
263rd/ 347
METRIC RANK
3.16
AVERAGE FAMILY SIZE
0.8/ 100
METRIC RATING
267th/ 347
METRIC RANK
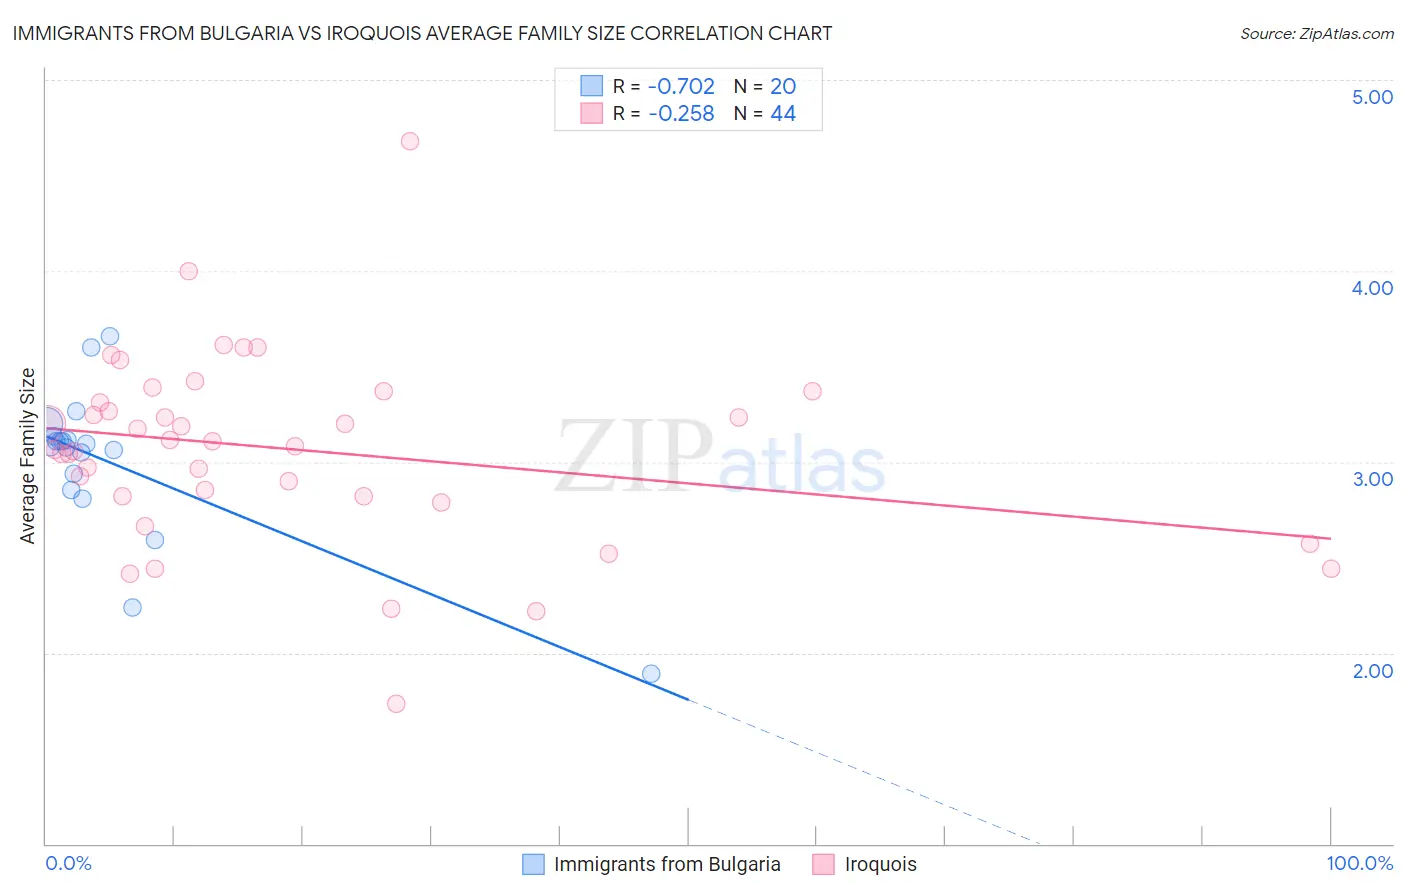
Immigrants from Bulgaria vs Iroquois Average Family Size Correlation Chart
The statistical analysis conducted on geographies consisting of 172,540,373 people shows a strong negative correlation between the proportion of Immigrants from Bulgaria and average family size in the United States with a correlation coefficient (R) of -0.702 and weighted average of 3.16. Similarly, the statistical analysis conducted on geographies consisting of 207,249,368 people shows a weak negative correlation between the proportion of Iroquois and average family size in the United States with a correlation coefficient (R) of -0.258 and weighted average of 3.16, a difference of 0.10%.
Average Family Size Correlation Summary
| Measurement | Immigrants from Bulgaria | Iroquois |
| Minimum | 1.89 | 1.73 |
| Maximum | 3.66 | 4.68 |
| Range | 1.77 | 2.95 |
| Mean | 3.00 | 3.07 |
| Median | 3.09 | 3.10 |
| Interquartile 25% (IQ1) | 2.89 | 2.82 |
| Interquartile 75% (IQ3) | 3.12 | 3.34 |
| Interquartile Range (IQR) | 0.23 | 0.52 |
| Standard Deviation (Sample) | 0.40 | 0.50 |
| Standard Deviation (Population) | 0.39 | 0.50 |
Demographics Similar to Immigrants from Bulgaria and Iroquois by Average Family Size
In terms of average family size, the demographic groups most similar to Immigrants from Bulgaria are American (3.16, a difference of 0.020%), Immigrants from South Africa (3.16, a difference of 0.070%), Immigrants from Greece (3.16, a difference of 0.080%), Immigrants from North Macedonia (3.16, a difference of 0.10%), and Immigrants from Russia (3.16, a difference of 0.10%). Similarly, the demographic groups most similar to Iroquois are Immigrants from Greece (3.16, a difference of 0.020%), Immigrants from South Africa (3.16, a difference of 0.030%), Maltese (3.16, a difference of 0.040%), Immigrants from Singapore (3.16, a difference of 0.050%), and American (3.16, a difference of 0.080%).
| Demographics | Rating | Rank | Average Family Size |
| Cape Verdeans | 1.6 /100 | #255 | Tragic 3.17 |
| Immigrants | Kazakhstan | 1.5 /100 | #256 | Tragic 3.17 |
| Albanians | 1.5 /100 | #257 | Tragic 3.17 |
| Turks | 1.3 /100 | #258 | Tragic 3.16 |
| Potawatomi | 1.3 /100 | #259 | Tragic 3.16 |
| Immigrants | Albania | 1.3 /100 | #260 | Tragic 3.16 |
| Immigrants | North Macedonia | 1.3 /100 | #261 | Tragic 3.16 |
| Immigrants | Russia | 1.3 /100 | #262 | Tragic 3.16 |
| Immigrants | Bulgaria | 1.0 /100 | #263 | Tragic 3.16 |
| Americans | 1.0 /100 | #264 | Tragic 3.16 |
| Immigrants | South Africa | 0.9 /100 | #265 | Tragic 3.16 |
| Immigrants | Greece | 0.9 /100 | #266 | Tragic 3.16 |
| Iroquois | 0.8 /100 | #267 | Tragic 3.16 |
| Maltese | 0.8 /100 | #268 | Tragic 3.16 |
| Immigrants | Singapore | 0.7 /100 | #269 | Tragic 3.16 |
| Tlingit-Haida | 0.7 /100 | #270 | Tragic 3.16 |
| Immigrants | Germany | 0.7 /100 | #271 | Tragic 3.15 |
| Immigrants | Lithuania | 0.6 /100 | #272 | Tragic 3.15 |
| New Zealanders | 0.6 /100 | #273 | Tragic 3.15 |
| Immigrants | Belgium | 0.6 /100 | #274 | Tragic 3.15 |
| Cambodians | 0.6 /100 | #275 | Tragic 3.15 |