Chilean vs Iroquois Average Family Size
COMPARE
Chilean
Iroquois
Average Family Size
Average Family Size Comparison
Chileans
Iroquois
3.23
AVERAGE FAMILY SIZE
53.2/ 100
METRIC RATING
171st/ 347
METRIC RANK
3.16
AVERAGE FAMILY SIZE
0.8/ 100
METRIC RATING
267th/ 347
METRIC RANK
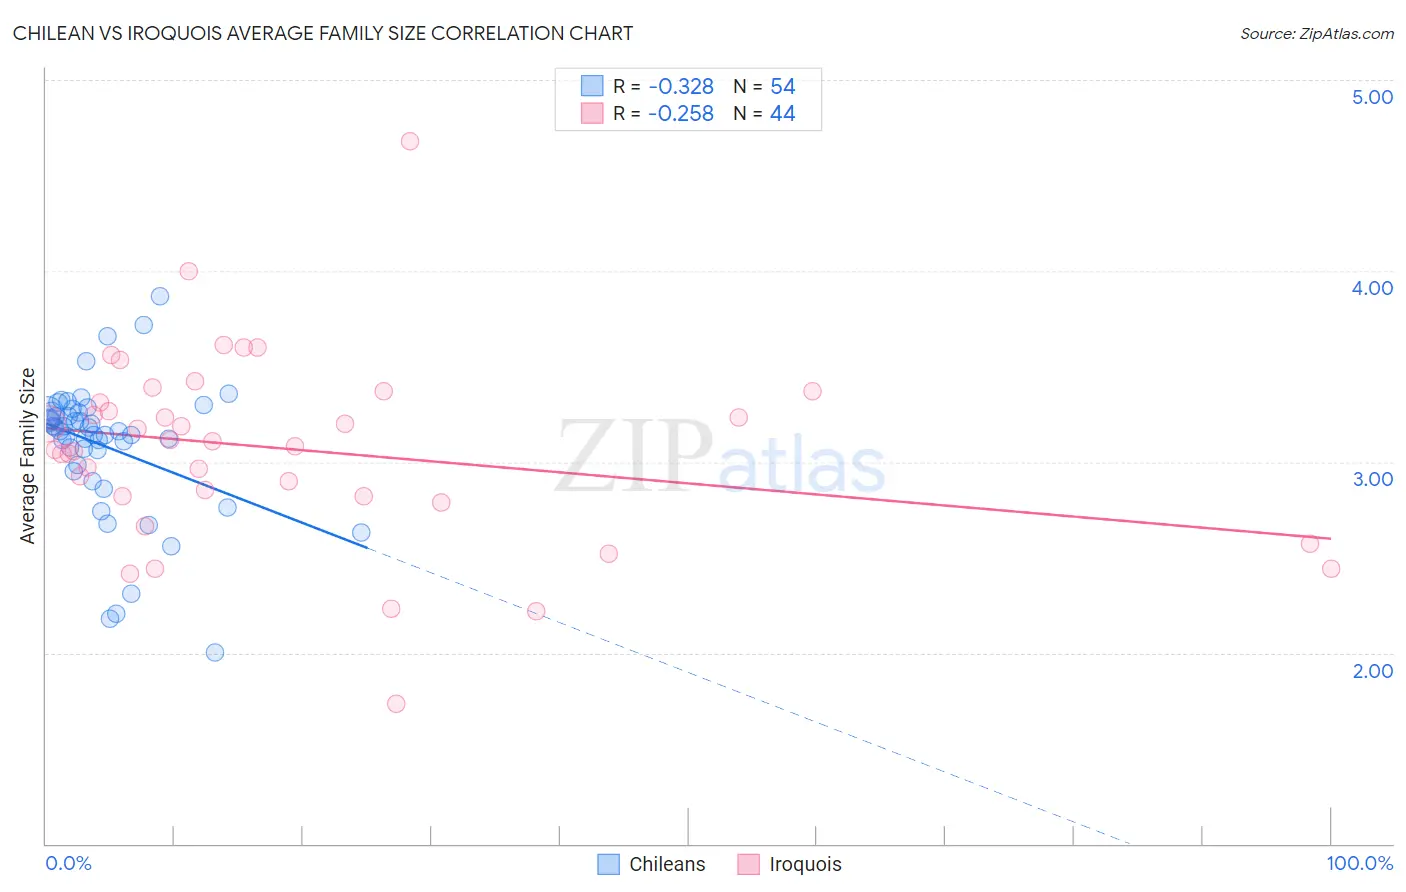
Chilean vs Iroquois Average Family Size Correlation Chart
The statistical analysis conducted on geographies consisting of 256,563,974 people shows a mild negative correlation between the proportion of Chileans and average family size in the United States with a correlation coefficient (R) of -0.328 and weighted average of 3.23. Similarly, the statistical analysis conducted on geographies consisting of 207,249,368 people shows a weak negative correlation between the proportion of Iroquois and average family size in the United States with a correlation coefficient (R) of -0.258 and weighted average of 3.16, a difference of 2.3%.
Average Family Size Correlation Summary
| Measurement | Chilean | Iroquois |
| Minimum | 2.00 | 1.73 |
| Maximum | 3.87 | 4.68 |
| Range | 1.87 | 2.95 |
| Mean | 3.08 | 3.07 |
| Median | 3.16 | 3.10 |
| Interquartile 25% (IQ1) | 2.98 | 2.82 |
| Interquartile 75% (IQ3) | 3.26 | 3.34 |
| Interquartile Range (IQR) | 0.27 | 0.52 |
| Standard Deviation (Sample) | 0.36 | 0.50 |
| Standard Deviation (Population) | 0.35 | 0.50 |
Similar Demographics by Average Family Size
Demographics Similar to Chileans by Average Family Size
In terms of average family size, the demographic groups most similar to Chileans are Arab (3.23, a difference of 0.010%), Immigrants from Congo (3.23, a difference of 0.010%), Taiwanese (3.23, a difference of 0.020%), Aleut (3.23, a difference of 0.020%), and Immigrants from Uruguay (3.23, a difference of 0.020%).
| Demographics | Rating | Rank | Average Family Size |
| Egyptians | 58.6 /100 | #164 | Average 3.23 |
| Ugandans | 58.4 /100 | #165 | Average 3.23 |
| Immigrants | Senegal | 57.5 /100 | #166 | Average 3.23 |
| Dutch West Indians | 56.9 /100 | #167 | Average 3.23 |
| Taiwanese | 54.2 /100 | #168 | Average 3.23 |
| Aleuts | 54.1 /100 | #169 | Average 3.23 |
| Arabs | 53.8 /100 | #170 | Average 3.23 |
| Chileans | 53.2 /100 | #171 | Average 3.23 |
| Immigrants | Congo | 52.7 /100 | #172 | Average 3.23 |
| Immigrants | Uruguay | 52.0 /100 | #173 | Average 3.23 |
| Immigrants | South Central Asia | 50.0 /100 | #174 | Average 3.23 |
| Immigrants | China | 49.9 /100 | #175 | Average 3.23 |
| Israelis | 48.7 /100 | #176 | Average 3.23 |
| Argentineans | 47.4 /100 | #177 | Average 3.23 |
| Spaniards | 47.2 /100 | #178 | Average 3.23 |
Demographics Similar to Iroquois by Average Family Size
In terms of average family size, the demographic groups most similar to Iroquois are Immigrants from Greece (3.16, a difference of 0.020%), Immigrants from South Africa (3.16, a difference of 0.030%), Maltese (3.16, a difference of 0.040%), Immigrants from Singapore (3.16, a difference of 0.050%), and American (3.16, a difference of 0.080%).
| Demographics | Rating | Rank | Average Family Size |
| Immigrants | Albania | 1.3 /100 | #260 | Tragic 3.16 |
| Immigrants | North Macedonia | 1.3 /100 | #261 | Tragic 3.16 |
| Immigrants | Russia | 1.3 /100 | #262 | Tragic 3.16 |
| Immigrants | Bulgaria | 1.0 /100 | #263 | Tragic 3.16 |
| Americans | 1.0 /100 | #264 | Tragic 3.16 |
| Immigrants | South Africa | 0.9 /100 | #265 | Tragic 3.16 |
| Immigrants | Greece | 0.9 /100 | #266 | Tragic 3.16 |
| Iroquois | 0.8 /100 | #267 | Tragic 3.16 |
| Maltese | 0.8 /100 | #268 | Tragic 3.16 |
| Immigrants | Singapore | 0.7 /100 | #269 | Tragic 3.16 |
| Tlingit-Haida | 0.7 /100 | #270 | Tragic 3.16 |
| Immigrants | Germany | 0.7 /100 | #271 | Tragic 3.15 |
| Immigrants | Lithuania | 0.6 /100 | #272 | Tragic 3.15 |
| New Zealanders | 0.6 /100 | #273 | Tragic 3.15 |
| Immigrants | Belgium | 0.6 /100 | #274 | Tragic 3.15 |