Nepalese vs Iroquois Average Family Size
COMPARE
Nepalese
Iroquois
Average Family Size
Average Family Size Comparison
Nepalese
Iroquois
3.42
AVERAGE FAMILY SIZE
100.0/ 100
METRIC RATING
29th/ 347
METRIC RANK
3.16
AVERAGE FAMILY SIZE
0.8/ 100
METRIC RATING
267th/ 347
METRIC RANK
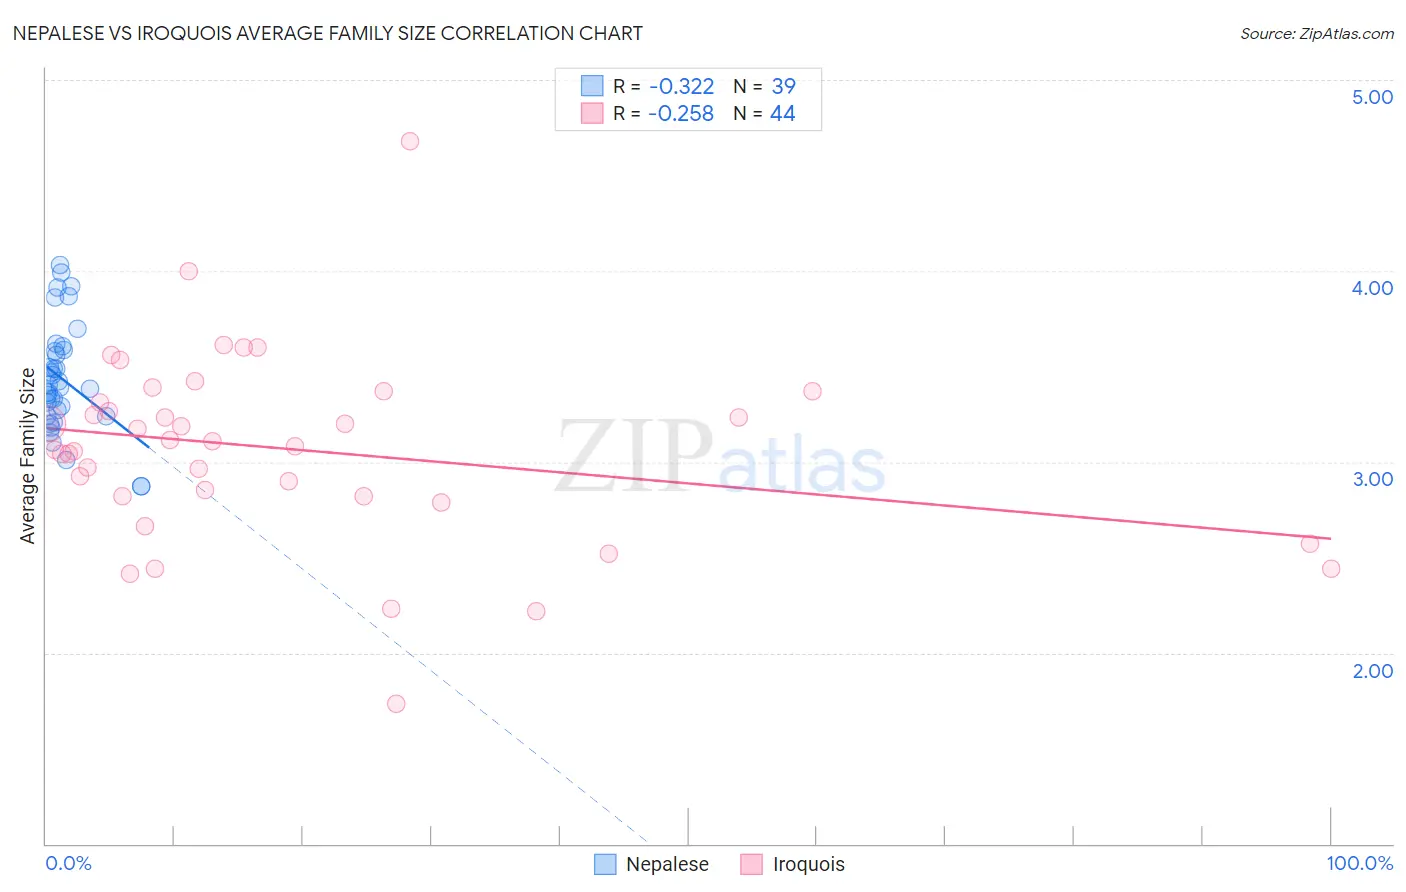
Nepalese vs Iroquois Average Family Size Correlation Chart
The statistical analysis conducted on geographies consisting of 24,519,269 people shows a mild negative correlation between the proportion of Nepalese and average family size in the United States with a correlation coefficient (R) of -0.322 and weighted average of 3.42. Similarly, the statistical analysis conducted on geographies consisting of 207,249,368 people shows a weak negative correlation between the proportion of Iroquois and average family size in the United States with a correlation coefficient (R) of -0.258 and weighted average of 3.16, a difference of 8.3%.
Average Family Size Correlation Summary
| Measurement | Nepalese | Iroquois |
| Minimum | 2.87 | 1.73 |
| Maximum | 4.03 | 4.68 |
| Range | 1.16 | 2.95 |
| Mean | 3.43 | 3.07 |
| Median | 3.39 | 3.10 |
| Interquartile 25% (IQ1) | 3.24 | 2.82 |
| Interquartile 75% (IQ3) | 3.59 | 3.34 |
| Interquartile Range (IQR) | 0.34 | 0.52 |
| Standard Deviation (Sample) | 0.28 | 0.50 |
| Standard Deviation (Population) | 0.28 | 0.50 |
Similar Demographics by Average Family Size
Demographics Similar to Nepalese by Average Family Size
In terms of average family size, the demographic groups most similar to Nepalese are Samoan (3.42, a difference of 0.030%), Immigrants from Latin America (3.42, a difference of 0.090%), Mexican American Indian (3.43, a difference of 0.21%), Native Hawaiian (3.43, a difference of 0.22%), and Central American (3.41, a difference of 0.23%).
| Demographics | Rating | Rank | Average Family Size |
| Apache | 100.0 /100 | #22 | Exceptional 3.46 |
| Immigrants | Fiji | 100.0 /100 | #23 | Exceptional 3.45 |
| Natives/Alaskans | 100.0 /100 | #24 | Exceptional 3.45 |
| Yakama | 100.0 /100 | #25 | Exceptional 3.45 |
| Native Hawaiians | 100.0 /100 | #26 | Exceptional 3.43 |
| Mexican American Indians | 100.0 /100 | #27 | Exceptional 3.43 |
| Immigrants | Latin America | 100.0 /100 | #28 | Exceptional 3.42 |
| Nepalese | 100.0 /100 | #29 | Exceptional 3.42 |
| Samoans | 100.0 /100 | #30 | Exceptional 3.42 |
| Central Americans | 100.0 /100 | #31 | Exceptional 3.41 |
| Immigrants | Guatemala | 100.0 /100 | #32 | Exceptional 3.41 |
| Hawaiians | 100.0 /100 | #33 | Exceptional 3.41 |
| Hispanics or Latinos | 100.0 /100 | #34 | Exceptional 3.41 |
| Guatemalans | 100.0 /100 | #35 | Exceptional 3.40 |
| Immigrants | Guyana | 100.0 /100 | #36 | Exceptional 3.40 |
Demographics Similar to Iroquois by Average Family Size
In terms of average family size, the demographic groups most similar to Iroquois are Immigrants from Greece (3.16, a difference of 0.020%), Immigrants from South Africa (3.16, a difference of 0.030%), Maltese (3.16, a difference of 0.040%), Immigrants from Singapore (3.16, a difference of 0.050%), and American (3.16, a difference of 0.080%).
| Demographics | Rating | Rank | Average Family Size |
| Immigrants | Albania | 1.3 /100 | #260 | Tragic 3.16 |
| Immigrants | North Macedonia | 1.3 /100 | #261 | Tragic 3.16 |
| Immigrants | Russia | 1.3 /100 | #262 | Tragic 3.16 |
| Immigrants | Bulgaria | 1.0 /100 | #263 | Tragic 3.16 |
| Americans | 1.0 /100 | #264 | Tragic 3.16 |
| Immigrants | South Africa | 0.9 /100 | #265 | Tragic 3.16 |
| Immigrants | Greece | 0.9 /100 | #266 | Tragic 3.16 |
| Iroquois | 0.8 /100 | #267 | Tragic 3.16 |
| Maltese | 0.8 /100 | #268 | Tragic 3.16 |
| Immigrants | Singapore | 0.7 /100 | #269 | Tragic 3.16 |
| Tlingit-Haida | 0.7 /100 | #270 | Tragic 3.16 |
| Immigrants | Germany | 0.7 /100 | #271 | Tragic 3.15 |
| Immigrants | Lithuania | 0.6 /100 | #272 | Tragic 3.15 |
| New Zealanders | 0.6 /100 | #273 | Tragic 3.15 |
| Immigrants | Belgium | 0.6 /100 | #274 | Tragic 3.15 |