Subsaharan African vs Immigrants from Liberia Master's Degree
COMPARE
Subsaharan African
Immigrants from Liberia
Master's Degree
Master's Degree Comparison
Sub-Saharan Africans
Immigrants from Liberia
14.2%
MASTER'S DEGREE
19.4/ 100
METRIC RATING
210th/ 347
METRIC RANK
12.5%
MASTER'S DEGREE
0.6/ 100
METRIC RATING
258th/ 347
METRIC RANK
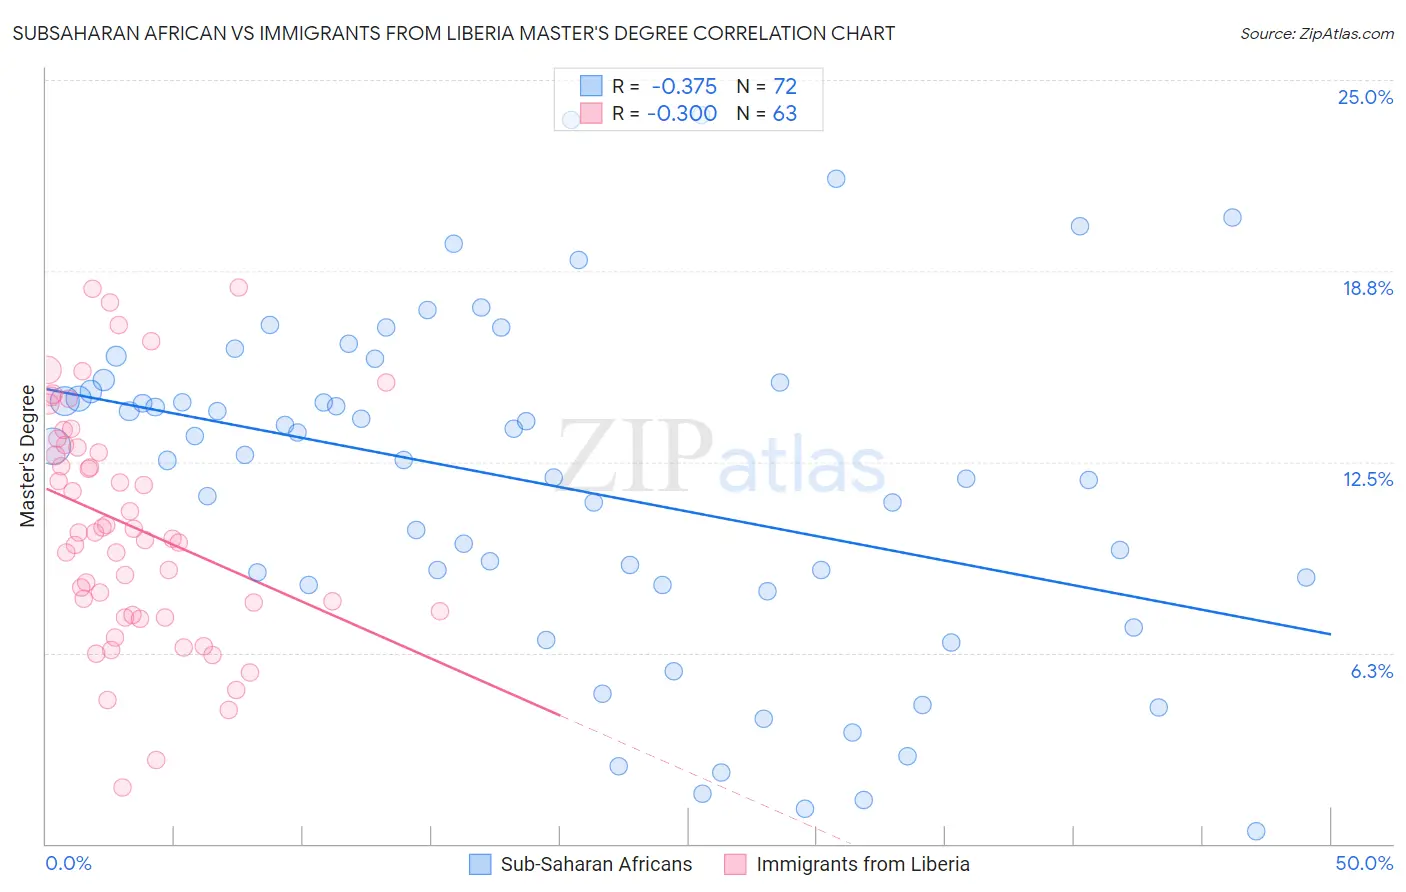
Subsaharan African vs Immigrants from Liberia Master's Degree Correlation Chart
The statistical analysis conducted on geographies consisting of 507,799,388 people shows a mild negative correlation between the proportion of Sub-Saharan Africans and percentage of population with at least master's degree education in the United States with a correlation coefficient (R) of -0.375 and weighted average of 14.2%. Similarly, the statistical analysis conducted on geographies consisting of 135,237,477 people shows a weak negative correlation between the proportion of Immigrants from Liberia and percentage of population with at least master's degree education in the United States with a correlation coefficient (R) of -0.300 and weighted average of 12.5%, a difference of 13.9%.
Master's Degree Correlation Summary
| Measurement | Subsaharan African | Immigrants from Liberia |
| Minimum | 0.40% | 1.9% |
| Maximum | 23.9% | 18.2% |
| Range | 23.5% | 16.4% |
| Mean | 11.7% | 10.4% |
| Median | 12.6% | 10.2% |
| Interquartile 25% (IQ1) | 8.5% | 7.5% |
| Interquartile 75% (IQ3) | 15.0% | 13.0% |
| Interquartile Range (IQR) | 6.5% | 5.6% |
| Standard Deviation (Sample) | 5.5% | 3.8% |
| Standard Deviation (Population) | 5.5% | 3.8% |
Similar Demographics by Master's Degree
Demographics Similar to Sub-Saharan Africans by Master's Degree
In terms of master's degree, the demographic groups most similar to Sub-Saharan Africans are Immigrants from Panama (14.3%, a difference of 0.13%), Immigrants from Barbados (14.3%, a difference of 0.22%), Somali (14.2%, a difference of 0.31%), Spanish (14.2%, a difference of 0.36%), and Immigrants from Bosnia and Herzegovina (14.3%, a difference of 0.52%).
| Demographics | Rating | Rank | Master's Degree |
| Yugoslavians | 24.3 /100 | #203 | Fair 14.4% |
| French | 23.7 /100 | #204 | Fair 14.4% |
| Trinidadians and Tobagonians | 23.5 /100 | #205 | Fair 14.4% |
| Scandinavians | 23.3 /100 | #206 | Fair 14.4% |
| Immigrants | Bosnia and Herzegovina | 22.0 /100 | #207 | Fair 14.3% |
| Immigrants | Barbados | 20.5 /100 | #208 | Fair 14.3% |
| Immigrants | Panama | 20.0 /100 | #209 | Fair 14.3% |
| Sub-Saharan Africans | 19.4 /100 | #210 | Poor 14.2% |
| Somalis | 18.0 /100 | #211 | Poor 14.2% |
| Spanish | 17.8 /100 | #212 | Poor 14.2% |
| Immigrants | Thailand | 17.0 /100 | #213 | Poor 14.2% |
| Finns | 16.9 /100 | #214 | Poor 14.2% |
| Immigrants | Vietnam | 16.1 /100 | #215 | Poor 14.1% |
| Immigrants | Somalia | 15.8 /100 | #216 | Poor 14.1% |
| Immigrants | Trinidad and Tobago | 15.8 /100 | #217 | Poor 14.1% |
Demographics Similar to Immigrants from Liberia by Master's Degree
In terms of master's degree, the demographic groups most similar to Immigrants from Liberia are Japanese (12.5%, a difference of 0.090%), Dominican (12.5%, a difference of 0.10%), Tongan (12.5%, a difference of 0.13%), Nicaraguan (12.5%, a difference of 0.32%), and Osage (12.6%, a difference of 0.50%).
| Demographics | Rating | Rank | Master's Degree |
| Tlingit-Haida | 1.3 /100 | #251 | Tragic 12.8% |
| French American Indians | 1.0 /100 | #252 | Tragic 12.7% |
| Immigrants | Dominica | 0.8 /100 | #253 | Tragic 12.6% |
| Indonesians | 0.8 /100 | #254 | Tragic 12.6% |
| Immigrants | Congo | 0.8 /100 | #255 | Tragic 12.6% |
| Immigrants | Portugal | 0.8 /100 | #256 | Tragic 12.6% |
| Osage | 0.7 /100 | #257 | Tragic 12.6% |
| Immigrants | Liberia | 0.6 /100 | #258 | Tragic 12.5% |
| Japanese | 0.6 /100 | #259 | Tragic 12.5% |
| Dominicans | 0.6 /100 | #260 | Tragic 12.5% |
| Tongans | 0.6 /100 | #261 | Tragic 12.5% |
| Nicaraguans | 0.6 /100 | #262 | Tragic 12.5% |
| Central American Indians | 0.5 /100 | #263 | Tragic 12.4% |
| Belizeans | 0.5 /100 | #264 | Tragic 12.4% |
| Immigrants | Fiji | 0.5 /100 | #265 | Tragic 12.4% |